
Page 147 - The Principle of Economics
P. 147
CHAPTER 7 CONSUMERS, PRODUCERS, AND THE EFFICIENCY OF MARKETS 149
USING THE SUPPLY CURVE TO MEASURE PRODUCER SURPLUS
Just as consumer surplus is closely related to the demand curve, producer surplus is closely related to the supply curve. To see how, let’s continue our example.
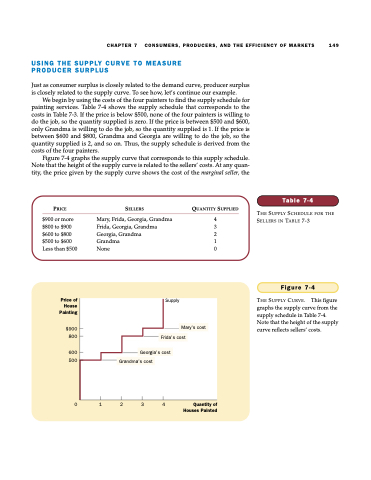
We begin by using the costs of the four painters to find the supply schedule for painting services. Table 7-4 shows the supply schedule that corresponds to the costs in Table 7-3. If the price is below $500, none of the four painters is willing to do the job, so the quantity supplied is zero. If the price is between $500 and $600, only Grandma is willing to do the job, so the quantity supplied is 1. If the price is between $600 and $800, Grandma and Georgia are willing to do the job, so the quantity supplied is 2, and so on. Thus, the supply schedule is derived from the costs of the four painters.
Figure 7-4 graphs the supply curve that corresponds to this supply schedule. Note that the height of the supply curve is related to the sellers’ costs. At any quan- tity, the price given by the supply curve shows the cost of the marginal seller, the
PRICE
$900 or more $800 to $900 $600 to $800 $500 to $600 Less than $500
SELLERS
Mary, Frida, Georgia, Grandma Frida, Georgia, Grandma Georgia, Grandma
Grandma
None
QUANTITY SUPPLIED
4 3 2 1 0
Table 7-4
THE SUPPLY SCHEDULE FOR THE SELLERS IN TABLE 7-3
Supply
Grandma’s cost
Georgia’s cost
Frida’s cost
Mary’s cost
Price of House Painting
$900 800
600
500
0
Figure 7-4
THE SUPPLY CURVE. This figure graphs the supply curve from the supply schedule in Table 7-4. Note that the height of the supply curve reflects sellers’ costs.
1 2 3 4 Quantityof Houses Painted
