
Page 171 - The Principle of Economics
P. 171
CHAPTER 8 APPLICATION: THE COSTS OF TAXATION 173
Deadweight Loss
0
Tax Revenue
Tax Size
(a) Deadweight Loss
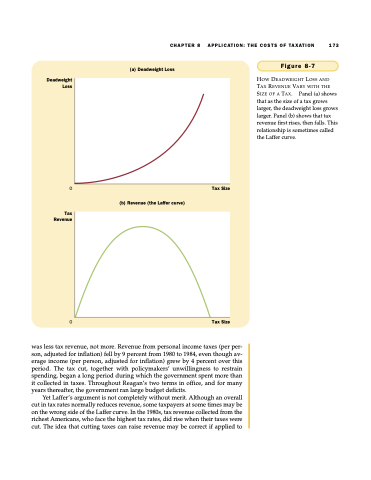
Figure 8-7
HOW DEADWEIGHT LOSS AND TAX REVENUE VARY WITH THE SIZE OF A TAX. Panel (a) shows that as the size of a tax grows larger, the deadweight loss grows larger. Panel (b) shows that tax revenue first rises, then falls. This relationship is sometimes called the Laffer curve.
(b) Revenue (the Laffer curve)
0
Tax Size
was less tax revenue, not more. Revenue from personal income taxes (per per- son, adjusted for inflation) fell by 9 percent from 1980 to 1984, even though av- erage income (per person, adjusted for inflation) grew by 4 percent over this period. The tax cut, together with policymakers’ unwillingness to restrain spending, began a long period during which the government spent more than it collected in taxes. Throughout Reagan’s two terms in office, and for many years thereafter, the government ran large budget deficits.
Yet Laffer’s argument is not completely without merit. Although an overall cut in tax rates normally reduces revenue, some taxpayers at some times may be on the wrong side of the Laffer curve. In the 1980s, tax revenue collected from the richest Americans, who face the highest tax rates, did rise when their taxes were cut. The idea that cutting taxes can raise revenue may be correct if applied to
