
Page 253 - The Principle of Economics
P. 253
CHAPTER 12 THE DESIGN OF THE TAX SYSTEM 257
AVERAGE
INCOME
Lowest
Second 26,100 Middle 44,300 Fourth 68,200 Highest 174,000
TAXES AS A
PERCENT OF INCOME
8.0% 15.6
20.3 23.1 29.1
PERCENT OF
ALL INCOME
4% 11
16 20 49
PERCENT OF
ALL TAXES
1%
7 13 19 59
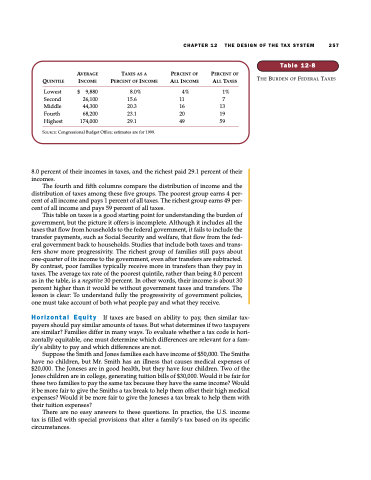
Table 12-8
THE BURDEN OF FEDERAL TAXES
QUINTILE
$ 9,880
SOURCE: Congressional Budget Office; estimates are for 1999.
8.0 percent of their incomes in taxes, and the richest paid 29.1 percent of their incomes.
The fourth and fifth columns compare the distribution of income and the distribution of taxes among these five groups. The poorest group earns 4 per- cent of all income and pays 1 percent of all taxes. The richest group earns 49 per- cent of all income and pays 59 percent of all taxes.
This table on taxes is a good starting point for understanding the burden of government, but the picture it offers is incomplete. Although it includes all the taxes that flow from households to the federal government, it fails to include the transfer payments, such as Social Security and welfare, that flow from the fed- eral government back to households. Studies that include both taxes and trans- fers show more progressivity. The richest group of families still pays about one-quarter of its income to the government, even after transfers are subtracted. By contrast, poor families typically receive more in transfers than they pay in taxes. The average tax rate of the poorest quintile, rather than being 8.0 percent as in the table, is a negative 30 percent. In other words, their income is about 30 percent higher than it would be without government taxes and transfers. The lesson is clear: To understand fully the progressivity of government policies, one must take account of both what people pay and what they receive.
Horizontal Equity If taxes are based on ability to pay, then similar tax- payers should pay similar amounts of taxes. But what determines if two taxpayers are similar? Families differ in many ways. To evaluate whether a tax code is hori- zontally equitable, one must determine which differences are relevant for a fam- ily’s ability to pay and which differences are not.
Suppose the Smith and Jones families each have income of $50,000. The Smiths have no children, but Mr. Smith has an illness that causes medical expenses of $20,000. The Joneses are in good health, but they have four children. Two of the Jones children are in college, generating tuition bills of $30,000. Would it be fair for these two families to pay the same tax because they have the same income? Would it be more fair to give the Smiths a tax break to help them offset their high medical expenses? Would it be more fair to give the Joneses a tax break to help them with their tuition expenses?
There are no easy answers to these questions. In practice, the U.S. income tax is filled with special provisions that alter a family’s tax based on its specific circumstances.
