
Page 303 - The Principle of Economics
P. 303
Price
P1
0
Price
P2 P1
0
Price
P1
0
Q1
Quantity (market)
Firm
(a) Initial Condition Price
P1
Quantity (firm) 0 (b) Short-Run Response
Price
P2 P1
Quantity (firm) 0 (c) Long-Run Response
Price
P2 P1
Quantity (firm) 0
Market
Profit
MC ATC
MC
ATC P
Firm
Market
A
Short-run supply, S1
Long-run supply
Demand, D1
S1
B
A
Long-run supply
D2 D1
Firm
Q1 Q2
Market
Quantity (market)
MC
ATC
A
S1
B
C
S2
Long-run supply
D2
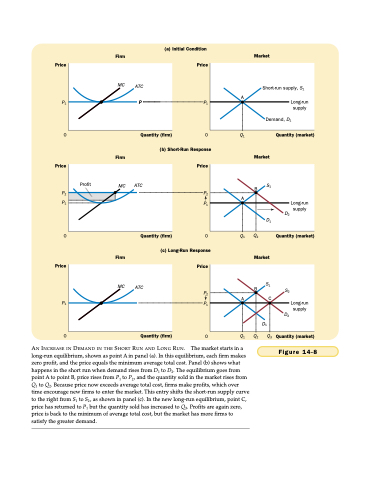
AN INCREASE IN DEMAND IN THE SHORT RUN AND LONG RUN.
long-run equilibrium, shown as point A in panel (a). In this equilibrium, each firm makes zero profit, and the price equals the minimum average total cost. Panel (b) shows what happens in the short run when demand rises from D1 to D2. The equilibrium goes from point A to point B, price rises from P1 to P2 , and the quantity sold in the market rises from Q1 to Q2. Because price now exceeds average total cost, firms make profits, which over time encourage new firms to enter the market. This entry shifts the short-run supply curve to the right from S1 to S2, as shown in panel (c). In the new long-run equilibrium, point C, price has returned to P1 but the quantity sold has increased to Q3. Profits are again zero, price is back to the minimum of average total cost, but the market has more firms to satisfy the greater demand.
The market starts in a
Q1 Q2
Q3
Quantity (market)
Figure 14-8
D1
