
Page 392 - The Principle of Economics
P. 392
400
PART SIX
THE ECONOMICS OF LABOR MARKETS
LABOR
L
(NUMBER OF WORKERS)
OUTPUT
Q
(BUSHELS PER WEEK)
MARGINAL PRODUCT
OF LABOR
MPL ∆Q/∆L (BUSHELS PER WEEK)
100 80 60 40 20
VALUE OF THE MARGINAL PRODUCT
OF LABOR WAGE
VMPL P MPL W $1,000 $500
800 500 600 500 400 500 200 500
MARGINAL
PROFIT ∆PROFIT
VMPL W $500
300
100 100 300
00
1 2 3 4 5
Table 18-1
100
180
240
280
300
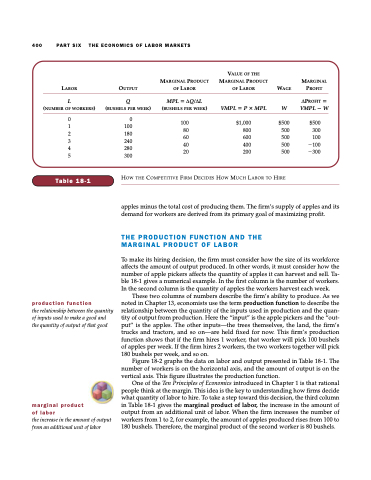
HOW THE COMPETITIVE FIRM DECIDES HOW MUCH LABOR TO HIRE
production function
the relationship between the quantity of inputs used to make a good and the quantity of output of that good
marginal product
of labor
the increase in the amount of output from an additional unit of labor
apples minus the total cost of producing them. The firm’s supply of apples and its demand for workers are derived from its primary goal of maximizing profit.
THE PRODUCTION FUNCTION AND THE MARGINAL PRODUCT OF LABOR
To make its hiring decision, the firm must consider how the size of its workforce affects the amount of output produced. In other words, it must consider how the number of apple pickers affects the quantity of apples it can harvest and sell. Ta- ble 18-1 gives a numerical example. In the first column is the number of workers. In the second column is the quantity of apples the workers harvest each week.
These two columns of numbers describe the firm’s ability to produce. As we noted in Chapter 13, economists use the term production function to describe the relationship between the quantity of the inputs used in production and the quan- tity of output from production. Here the “input” is the apple pickers and the “out- put” is the apples. The other inputs—the trees themselves, the land, the firm’s trucks and tractors, and so on—are held fixed for now. This firm’s production function shows that if the firm hires 1 worker, that worker will pick 100 bushels of apples per week. If the firm hires 2 workers, the two workers together will pick 180 bushels per week, and so on.
Figure 18-2 graphs the data on labor and output presented in Table 18-1. The number of workers is on the horizontal axis, and the amount of output is on the vertical axis. This figure illustrates the production function.
One of the Ten Principles of Economics introduced in Chapter 1 is that rational people think at the margin. This idea is the key to understanding how firms decide what quantity of labor to hire. To take a step toward this decision, the third column in Table 18-1 gives the marginal product of labor, the increase in the amount of output from an additional unit of labor. When the firm increases the number of workers from 1 to 2, for example, the amount of apples produced rises from 100 to 180 bushels. Therefore, the marginal product of the second worker is 80 bushels.
