
Page 400 - The Principle of Economics
P. 400
408 PART SIX
THE ECONOMICS OF LABOR MARKETS
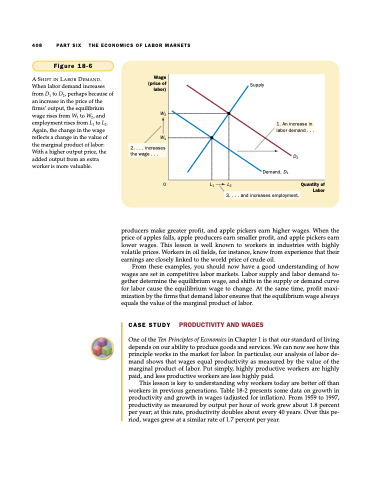
Figure 18-6
Wage (price of labor)
A SHIFT IN LABOR DEMAND.
When labor demand increases
from D1 to D2, perhaps because of
an increase in the price of the
firms’ output, the equilibrium
wage rises from W1 to W2, and
employment rises from L1 to L2.
Again, the change in the wage
reflects a change in the value of W1 the marginal product of labor:
With a higher output price, the
added output from an extra
worker is more valuable.
0 L1 L2
3. . . . and increases employment.
W2
Supply
Demand, D1
1. An increase in labor demand . . .
D2
2. . . . increases the wage . . .
Quantity of Labor
producers make greater profit, and apple pickers earn higher wages. When the price of apples falls, apple producers earn smaller profit, and apple pickers earn lower wages. This lesson is well known to workers in industries with highly volatile prices. Workers in oil fields, for instance, know from experience that their earnings are closely linked to the world price of crude oil.
From these examples, you should now have a good understanding of how wages are set in competitive labor markets. Labor supply and labor demand to- gether determine the equilibrium wage, and shifts in the supply or demand curve for labor cause the equilibrium wage to change. At the same time, profit maxi- mization by the firms that demand labor ensures that the equilibrium wage always equals the value of the marginal product of labor.
CASE STUDY PRODUCTIVITY AND WAGES
One of the Ten Principles of Economics in Chapter 1 is that our standard of living depends on our ability to produce goods and services. We can now see how this principle works in the market for labor. In particular, our analysis of labor de- mand shows that wages equal productivity as measured by the value of the marginal product of labor. Put simply, highly productive workers are highly paid, and less productive workers are less highly paid.
This lesson is key to understanding why workers today are better off than workers in previous generations. Table 18-2 presents some data on growth in productivity and growth in wages (adjusted for inflation). From 1959 to 1997, productivity as measured by output per hour of work grew about 1.8 percent per year; at this rate, productivity doubles about every 40 years. Over this pe- riod, wages grew at a similar rate of 1.7 percent per year.
