
Page 502 - The Principle of Economics
P. 502
514
PART EIGHT
THE DATA OF MACROECONOMICS
FYI
What Is in the CPI’s Basket?
When constructing the con- sumer price index, the Bureau of Labor Statistics tries to include all the goods and ser- vices that the typical consumer buys. Moreover, it tries to weight these goods and ser- vices according to how much consumers buy of each item.
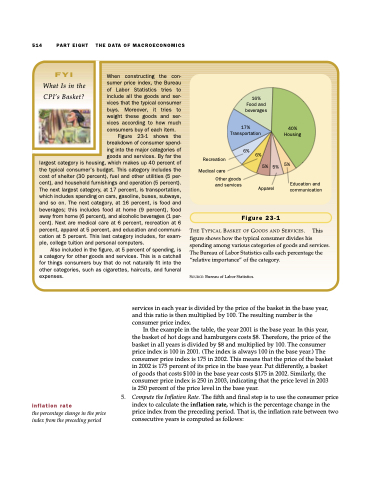
Figure 23-1 shows the breakdown of consumer spend- ing into the major categories of goods and services. By far the
16% Food and beverages
17% Transportation
6%
6%
40% Housing
largest category is housing, which makes up 40 percent of the typical consumer’s budget. This category includes the cost of shelter (30 percent), fuel and other utilities (5 per- cent), and household furnishings and operation (5 percent). The next largest category, at 17 percent, is transportation, which includes spending on cars, gasoline, buses, subways, and so on. The next category, at 16 percent, is food and beverages; this includes food at home (9 percent), food away from home (6 percent), and alcoholic beverages (1 per- cent). Next are medical care at 6 percent, recreation at 6 percent, apparel at 5 percent, and education and communi- cation at 5 percent. This last category includes, for exam- ple, college tuition and personal computers.
Also included in the figure, at 5 percent of spending, is a category for other goods and services. This is a catchall for things consumers buy that do not naturally fit into the other categories, such as cigarettes, haircuts, and funeral expenses.
Recreation
Medical care
5% 5% 5%
Education and
inflation rate
the percentage change in the price index from the preceding period
services in each year is divided by the price of the basket in the base year, and this ratio is then multiplied by 100. The resulting number is the consumer price index.
In the example in the table, the year 2001 is the base year. In this year, the basket of hot dogs and hamburgers costs $8. Therefore, the price of the basket in all years is divided by $8 and multiplied by 100. The consumer price index is 100 in 2001. (The index is always 100 in the base year.) The consumer price index is 175 in 2002. This means that the price of the basket in 2002 is 175 percent of its price in the base year. Put differently, a basket of goods that costs $100 in the base year costs $175 in 2002. Similarly, the consumer price index is 250 in 2003, indicating that the price level in 2003 is 250 percent of the price level in the base year.
5. Compute the Inflation Rate. The fifth and final step is to use the consumer price index to calculate the inflation rate, which is the percentage change in the price index from the preceding period. That is, the inflation rate between two consecutive years is computed as follows:
Other goods and services
Apparel
Figure 23-1
THE TYPICAL BASKET OF GOODS AND SERVICES. This figure shows how the typical consumer divides his spending among various categories of goods and services. The Bureau of Labor Statistics calls each percentage the “relative importance” of the category.
SOURCE: Bureau of Labor Statistics.
communication
