
Page 508 - The Principle of Economics
P. 508
520 PART EIGHT
THE DATA OF MACROECONOMICS
Figure 23-2
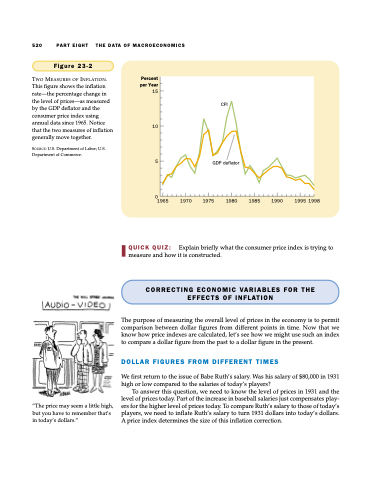
TWO MEASURES OF INFLATION. This figure shows the inflation rate—the percentage change in the level of prices—as measured by the GDP deflator and the consumer price index using annual data since 1965. Notice that the two measures of inflation generally move together.
SOURCE: U.S. Department of Labor; U.S. Department of Commerce.
Percent per Year 15
10
5
0
1965 1970 1975
CPI
GDP deflator
1980 1985 1990
1995 1998
”The price may seem a little high, but you have to remember that’s in today’s dollars.”
QUICK QUIZ: Explain briefly what the consumer price index is trying to measure and how it is constructed.
CORRECTING ECONOMIC VARIABLES FOR THE EFFECTS OF INFLATION
The purpose of measuring the overall level of prices in the economy is to permit comparison between dollar figures from different points in time. Now that we know how price indexes are calculated, let’s see how we might use such an index to compare a dollar figure from the past to a dollar figure in the present.
DOLLAR FIGURES FROM DIFFERENT TIMES
We first return to the issue of Babe Ruth’s salary. Was his salary of $80,000 in 1931 high or low compared to the salaries of today’s players?
To answer this question, we need to know the level of prices in 1931 and the level of prices today. Part of the increase in baseball salaries just compensates play- ers for the higher level of prices today. To compare Ruth’s salary to those of today’s players, we need to inflate Ruth’s salary to turn 1931 dollars into today’s dollars. A price index determines the size of this inflation correction.
