
Page 543 - The Principle of Economics
P. 543
CHAPTER 25 SAVING, INVESTMENT, AND THE FINANCIAL SYSTEM 557
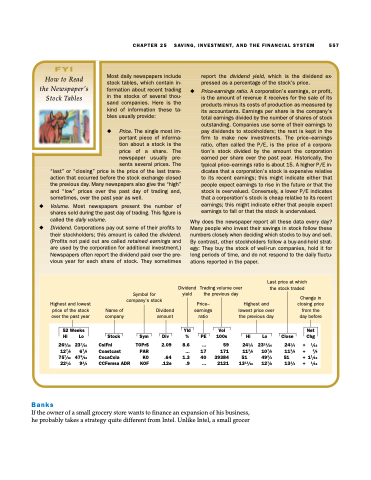
FYI
How to Read the Newspaper’s Stock Tables
Most daily newspapers include stock tables, which contain in- formation about recent trading in the stocks of several thou- sand companies. Here is the kind of information these ta- bles usually provide:
N Price. The single most im- portant piece of informa- tion about a stock is the price of a share. The newspaper usually pre- sents several prices. The
report the dividend yield, which is the dividend ex- pressed as a percentage of the stock’s price.
N Price-earnings ratio. A corporation’s earnings, or profit, is the amount of revenue it receives for the sale of its products minus its costs of production as measured by its accountants. Earnings per share is the company’s total earnings divided by the number of shares of stock outstanding. Companies use some of their earnings to pay dividends to stockholders; the rest is kept in the firm to make new investments. The price–earnings ratio, often called the P/E, is the price of a corpora- tion’s stock divided by the amount the corporation earned per share over the past year. Historically, the typical price–earnings ratio is about 15. A higher P/E in- dicates that a corporation’s stock is expensive relative to its recent earnings; this might indicate either that people expect earnings to rise in the future or that the stock is overvalued. Conversely, a lower P/E indicates that a corporation’s stock is cheap relative to its recent earnings; this might indicate either that people expect earnings to fall or that the stock is undervalued.
Why does the newspaper report all these data every day? Many people who invest their savings in stock follow these numbers closely when deciding which stocks to buy and sell. By contrast, other stockholders follow a buy-and-hold strat- egy: They buy the stock of well-run companies, hold it for long periods of time, and do not respond to the daily fluctu- ations reported in the paper.
“last” or “closing” price is the price of the last trans- action that occurred before the stock exchange closed the previous day. Many newspapers also give the “high” and “low” prices over the past day of trading and, sometimes, over the past year as well.
N Volume. Most newspapers present the number of shares sold during the past day of trading. This figure is called the daily volume.
N Dividend. Corporations pay out some of their profits to their stockholders; this amount is called the dividend. (Profits not paid out are called retained earnings and are used by the corporation for additional investment.) Newspapers often report the dividend paid over the pre- vious year for each share of stock. They sometimes
Dividend yield
Last price at which Trading volume over the stock traded
Symbol for company’s stock
Dividend amount
the previous day
Change in closing price from the day before
Net Chg
+ 1/16 + 3/8 +11/16 + 1/16
Highest and lowest price of the stock over the past year
Name of company
Price– earnings ratio
Highest and lowest price over the previous day
Hi Lo
Banks
52 Weeks Hi Lo
Yld
Vol 100s
Stock
263/16 237/16 CslFnl TOPrS 2.09 8.6 ...
127/8 67/8 757/16 475/16 221/2 93/4
Coastcast PAR CocaCola KO CCFemsa ADR KOF
59 241/4 2313/16 241/4 171 113/8 107/8 113/8
39384 51 493/4 51 2121 1313/16 127/8 133/4
Sym
%
PE
Close
If the owner of a small grocery store wants to finance an expansion of his business, he probably takes a strategy quite different from Intel. Unlike Intel, a small grocer
Div
... 17 .64 1.3 40 .12e .9 ...
