
Page 559 - The Principle of Economics
P. 559
CHAPTER 25 SAVING, INVESTMENT, AND THE FINANCIAL SYSTEM 573
Congress would be tempted to spend the surplus on “pork barrel” projects of dubious value.
As this book was going to press, the debate over the budget surplus was still raging. There is room for reasonable people to disagree. The right policy depends on how valuable you view private investment, how valuable you view public investment, how distortionary you view taxation, and how reliable you view the political process.
CASE STUDY THE HISTORY OF U.S. GOVERNMENT DEBT
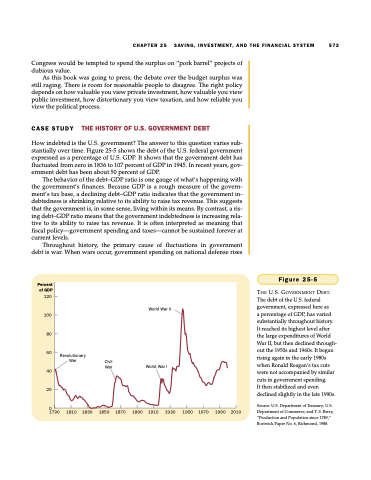
How indebted is the U.S. government? The answer to this question varies sub- stantially over time. Figure 25-5 shows the debt of the U.S. federal government expressed as a percentage of U.S. GDP. It shows that the government debt has fluctuated from zero in 1836 to 107 percent of GDP in 1945. In recent years, gov- ernment debt has been about 50 percent of GDP.
The behavior of the debt–GDP ratio is one gauge of what’s happening with the government’s finances. Because GDP is a rough measure of the govern- ment’s tax base, a declining debt–GDP ratio indicates that the government in- debtedness is shrinking relative to its ability to raise tax revenue. This suggests that the government is, in some sense, living within its means. By contrast, a ris- ing debt–GDP ratio means that the government indebtedness is increasing rela- tive to its ability to raise tax revenue. It is often interpreted as meaning that fiscal policy—government spending and taxes—cannot be sustained forever at current levels.
Throughout history, the primary cause of fluctuations in government debt is war. When wars occur, government spending on national defense rises
Percent of GDP 120
100
80
60
Revolutionar y
World War II
World War I
1890 1910 1930
Figure 25-5
THE U.S. GOVERNMENT DEBT. The debt of the U.S. federal government, expressed here as
a percentage of GDP, has varied substantially throughout history. It reached its highest level after the large expenditures of World War II, but then declined through- out the 1950s and 1960s. It began rising again in the early 1980s when Ronald Reagan’s tax cuts were not accompanied by similar cuts in government spending.
It then stabilized and even declined slightly in the late 1990s.
Source: U.S. Department of Treasury; U.S. Department of Commerce; and T. S. Berry, “Production and Population since 1789,” Bostwick Paper No. 6, Richmond, 1988.
War
Civil War
40
20
0
1790 1810 1830 1850 1870
1950 1970
1990 2010
