
Page 569 - The Principle of Economics
P. 569
CHAPTER 26 UNEMPLOYMENT AND ITS NATURAL RATE 583
UNEMPLOYMENT
DEMOGRAPHIC GROUP RATE
LABOR-FORCE
PARTICIPATION RATE
77.2% 59.7 72.5 64.8
56.6 55.4 40.7 42.5
Table 26-1
THE LABOR-MARKET EXPERIENCES OF VARIOUS DEMOGRAPHIC GROUPS. This table shows the unemployment rate and
the labor-force participation rate of various groups in the U.S. population for 1998.
ADULTS (AGES 20 AND OVER)
White, male White, female Black, male Black, female
TEENAGERS (AGES 16–19)
White, male White, female Black, male Black, female
SOURCE: Bureau of Labor Statistics.
Percent of Labor Force
10
8
6
4
2
0
3.2% 3.4 7.4 7.9
14.1 10.9 30.1 25.3
Unemployment rate
Natural rate of unemployment
1960 1965
1970
1975 1980
1985
1990 1995 2000
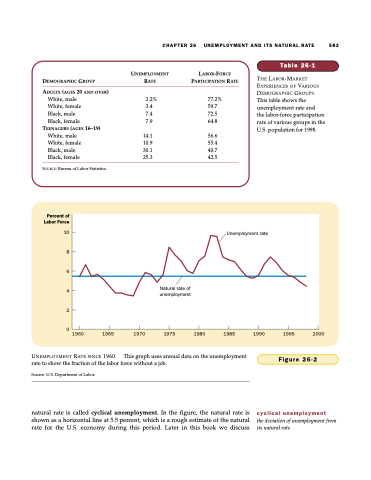
Figure 26-2
cyclical unemployment
the deviation of unemployment from its natural rate
UNEMPLOYMENT RATE SINCE 1960. This graph uses annual data on the unemployment rate to show the fraction of the labor force without a job.
Source: U.S. Department of Labor.
natural rate is called cyclical unemployment. In the figure, the natural rate is shown as a horizontal line at 5.5 percent, which is a rough estimate of the natural rate for the U.S. economy during this period. Later in this book we discuss
