
Page 621 - The Principle of Economics
P. 621
Price level
(c) Germany
(d) Poland
Price level
CHAPTER 28
MONEY GROWTH AND INFLATION 637
Index (Jan. 1921 = 100)
100,000 10,000
1,000
100
1921
Index (Jan. 1921 = 100)
100,000,000,000,000 1,000,000,000,000 10,000,000,000 100,000,000 1,000,000 10,000 100 1
1922
(a) Austria
1923
1924 1925
Index (July 1921 = 100)
100,000 10,000
1,000 100
Index (Jan. 1921 = 100)
10,000,000 1,000,000 100,000 10,000 1,000 100
1921
(b) Hungary
1922 1923 1924 1925
Price level
Money supply
Money supply
Price level
Money supply
1921
1922
1923
1924 1925
1921
1922 1923
Money supply
1924 1925
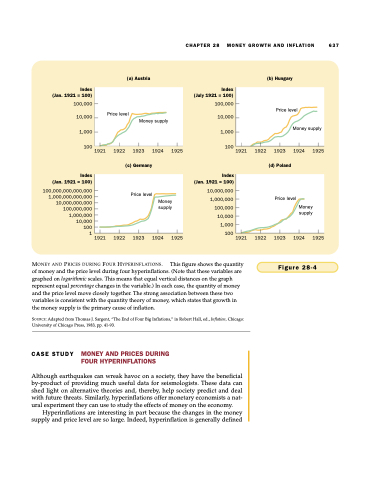
MONEY AND PRICES DURING FOUR HYPERINFLATIONS. This figure shows the quantity of money and the price level during four hyperinflations. (Note that these variables are graphed on logarithmic scales. This means that equal vertical distances on the graph represent equal percentage changes in the variable.) In each case, the quantity of money and the price level move closely together. The strong association between these two variables is consistent with the quantity theory of money, which states that growth in the money supply is the primary cause of inflation.
SOURCE: Adapted from Thomas J. Sargent, “The End of Four Big Inflations,” in Robert Hall, ed., Inflation, Chicago: University of Chicago Press, 1983, pp. 41-93.
Although earthquakes can wreak havoc on a society, they have the beneficial by-product of providing much useful data for seismologists. These data can shed light on alternative theories and, thereby, help society predict and deal with future threats. Similarly, hyperinflations offer monetary economists a nat- ural experiment they can use to study the effects of money on the economy.
Hyperinflations are interesting in part because the changes in the money supply and price level are so large. Indeed, hyperinflation is generally defined
Figure 28-4
CASE STUDY
MONEY AND PRICES DURING FOUR HYPERINFLATIONS
