
Page 683 - The Principle of Economics
P. 683
CHAPTER 31 AGGREGATE DEMAND AND AGGREGATE SUPPLY 703
(a) Real GDP
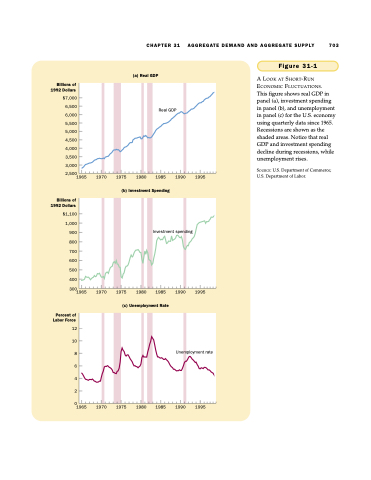
Figure 31-1
A LOOK AT SHORT-RUN ECONOMIC FLUCTUATIONS.
This figure shows real GDP in panel (a), investment spending in panel (b), and unemployment in panel (c) for the U.S. economy using quarterly data since 1965. Recessions are shown as the shaded areas. Notice that real GDP and investment spending decline during recessions, while unemployment rises.
SOURCE: U.S. Department of Commerce; U.S. Department of Labor.
Real GDP
Billions of 1992 Dollars
$7,000 6,500 6,000 5,500 5,000 4,500 4,000 3,500 3,000 2,500
1965 1970
Billions of 1992 Dollars
$1,100 1,000 900 800 700 600 500 400 300
1965 1970
Percent of Labor Force
12 10 8 6 4 2
0
1965 1970
1975 1980
1985 1990 1995
(b) Investment Spending
Investment spending
1975 1980
1985 1990 1995
(c) Unemployment Rate
Unemployment rate
1975 1980 1985 1990 1995
