
Page 687 - The Principle of Economics
P. 687
aggregate-supply curve is upward sloping, we need a macroeconomic theory. Developing such a theory is our next task.
QUICK QUIZ: How does the economy’s behavior in the short run differ from its behavior in the long run? N Draw the model of aggregate demand and aggregate supply. What variables are on the two axes?
THE AGGREGATE-DEMAND CURVE
The aggregate-demand curve tells us the quantity of all goods and services de- manded in the economy at any given price level. As Figure 31-3 illustrates, the aggregate-demand curve is downward sloping. This means that, other things equal, a fall in the economy’s overall level of prices (from, say, P1 to P2) tends to raise the quantity of goods and services demanded (from Y1 to Y2).
WHY THE AGGREGATE-DEMAND CURVE SLOPES DOWNWARD
Why does a fall in the price level raise the quantity of goods and services de- manded? To answer this question, it is useful to recall that GDP (which we denote as Y) is the sum of consumption (C), investment (I), government purchases (G), and net exports (NX):
CHAPTER 31 AGGREGATE DEMAND AND AGGREGATE SUPPLY 707
Aggregate supply
Aggregate demand
Price Level
Equilibrium price level
0 Equilibrium output
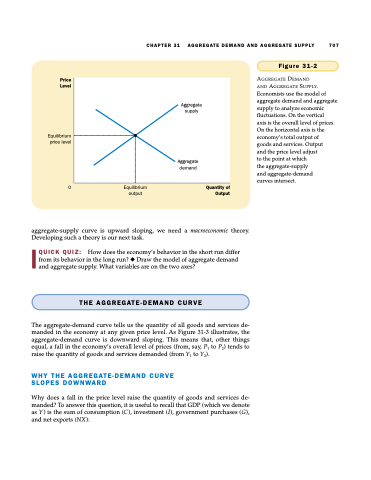
Figure 31-2
AGGREGATE DEMAND
AND AGGREGATE SUPPLY. Economists use the model of aggregate demand and aggregate supply to analyze economic fluctuations. On the vertical
axis is the overall level of prices. On the horizontal axis is the economy’s total output of
goods and services. Output
and the price level adjust
to the point at which
the aggregate-supply
and aggregate-demand
curves intersect.
Quantity of Output
