
Page 69 - The Principle of Economics
P. 69
THE DEMAND SCHEDULE AND THE DEMAND CURVE
We have seen that many variables determine the quantity of ice cream a person demands. Imagine that we hold all these variables constant except one—the price. Let’s consider how the price affects the quantity of ice cream demanded.
Table 4-1 shows how many ice-cream cones Catherine buys each month at dif- ferent prices of ice cream. If ice cream is free, Catherine eats 12 cones. At $0.50 per cone, Catherine buys 10 cones. As the price rises further, she buys fewer and fewer cones. When the price reaches $3.00, Catherine doesn’t buy any ice cream at all. Table 4-1 is a demand schedule, a table that shows the relationship between the price of a good and the quantity demanded. (Economists use the term schedule be- cause the table, with its parallel columns of numbers, resembles a train schedule.)
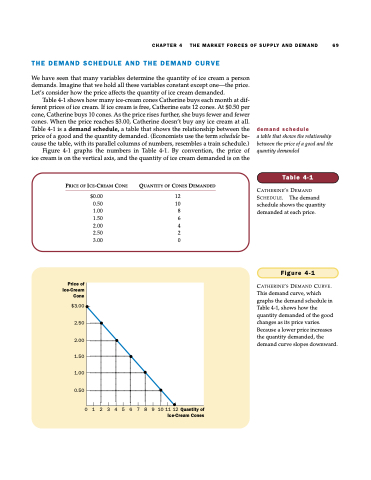
Figure 4-1 graphs the numbers in Table 4-1. By convention, the price of ice cream is on the vertical axis, and the quantity of ice cream demanded is on the
PRICEOFICE-CREAMCONE QUANTITYOFCONESDEMANDED
$0.00 12 0.50 10 1.00 8 1.50 6 2.00 4 2.50 2 3.00 0
demand schedule
a table that shows the relationship between the price of a good and the quantity demanded
Table 4-1
CATHERINE’S DEMAND SCHEDULE. The demand schedule shows the quantity demanded at each price.
CHAPTER 4 THE MARKET FORCES OF SUPPLY AND DEMAND 69
Price of Ice-Cream Cone
$3.00
2.50
2.00
1.50 1.00 0.50
Figure 4-1
CATHERINE’S DEMAND CURVE. This demand curve, which graphs the demand schedule in Table 4-1, shows how the quantity demanded of the good changes as its price varies. Because a lower price increases the quantity demanded, the demand curve slopes downward.
0 1 2 3 4 5 6 7 8 9101112Quantityof Ice-Cream Cones
