
Page 700 - The Principle of Economics
P. 700
720 PART TWELVE SHORT-RUN ECONOMIC FLUCTUATIONS
Table 31-2
THE SHORT-RUN AGGREGATE-SUPPLY CURVE: SUMMARY
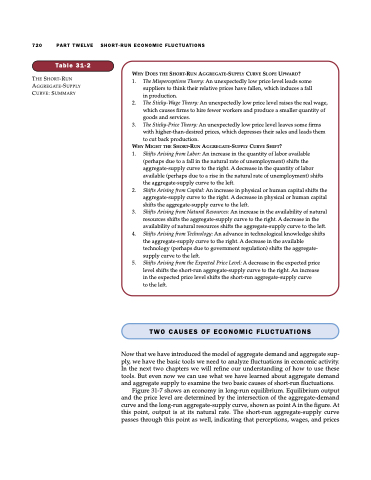
WHY DOES THE SHORT-RUN AGGREGATE-SUPPLY CURVE SLOPE UPWARD?
1. The Misperceptions Theory: An unexpectedly low price level leads some suppliers to think their relative prices have fallen, which induces a fall in production.
2. The Sticky-Wage Theory: An unexpectedly low price level raises the real wage, which causes firms to hire fewer workers and produce a smaller quantity of goods and services.
3. The Sticky-Price Theory: An unexpectedly low price level leaves some firms with higher-than-desired prices, which depresses their sales and leads them to cut back production.
WHY MIGHT THE SHORT-RUN AGGREGATE-SUPPLY CURVE SHIFT?
1. Shifts Arising from Labor: An increase in the quantity of labor available (perhaps due to a fall in the natural rate of unemployment) shifts the aggregate-supply curve to the right. A decrease in the quantity of labor available (perhaps due to a rise in the natural rate of unemployment) shifts the aggregate-supply curve to the left.
2. Shifts Arising from Capital: An increase in physical or human capital shifts the aggregate-supply curve to the right. A decrease in physical or human capital shifts the aggregate-supply curve to the left.
3. Shifts Arising from Natural Resources: An increase in the availability of natural resources shifts the aggregate-supply curve to the right. A decrease in the availability of natural resources shifts the aggregate-supply curve to the left.
4. Shifts Arising from Technology: An advance in technological knowledge shifts the aggregate-supply curve to the right. A decrease in the available technology (perhaps due to government regulation) shifts the aggregate- supply curve to the left.
5. Shifts Arising from the Expected Price Level: A decrease in the expected price level shifts the short-run aggregate-supply curve to the right. An increase in the expected price level shifts the short-run aggregate-supply curve
to the left.
TWO CAUSES OF ECONOMIC FLUCTUATIONS
Now that we have introduced the model of aggregate demand and aggregate sup- ply, we have the basic tools we need to analyze fluctuations in economic activity. In the next two chapters we will refine our understanding of how to use these tools. But even now we can use what we have learned about aggregate demand and aggregate supply to examine the two basic causes of short-run fluctuations.
Figure 31-7 shows an economy in long-run equilibrium. Equilibrium output and the price level are determined by the intersection of the aggregate-demand curve and the long-run aggregate-supply curve, shown as point A in the figure. At this point, output is at its natural rate. The short-run aggregate-supply curve passes through this point as well, indicating that perceptions, wages, and prices
