
Page 718 - The Principle of Economics
P. 718
738 PART TWELVE
SHORT-RUN ECONOMIC FLUCTUATIONS
Figure 32-2
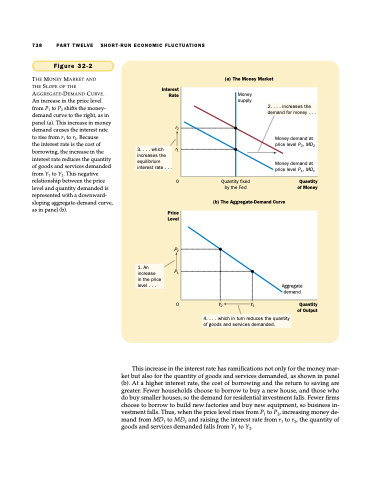
THE MONEY MARKET AND
THE SLOPE OF THE AGGREGATE-DEMAND CURVE. An increase in the price level from P1 to P2 shifts the money- demand curve to the right, as in panel (a). This increase in money demand causes the interest rate to rise from r1 to r2. Because
the interest rate is the cost of borrowing, the increase in the interest rate reduces the quantity of goods and services demanded from Y1 to Y2. This negative relationship between the price level and quantity demanded is represented with a downward- sloping aggregate-demand curve, as in panel (b).
(a) The Money Market
Money supply
Money demand at price level P2, MD2
Money demand at price level P1, MD1
2. . . . increases the demand for money . . .
Interest Rate
r2
r1
3. . . . which increases the equilibrium interest rate . . .
0 Quantity fixed by the Fed
Quantity of Money
(b) The Aggregate-Demand Curve
Aggregate demand
Price Level
P2
P1
1. An increase
in the price level . . .
0 Y2 Y1
Quantity of Output
4. . . . which in turn reduces the quantity of goods and services demanded.
This increase in the interest rate has ramifications not only for the money mar- ket but also for the quantity of goods and services demanded, as shown in panel (b). At a higher interest rate, the cost of borrowing and the return to saving are greater. Fewer households choose to borrow to buy a new house, and those who do buy smaller houses, so the demand for residential investment falls. Fewer firms choose to borrow to build new factories and buy new equipment, so business in- vestment falls. Thus, when the price level rises from P1 to P2, increasing money de- mand from MD1 to MD2 and raising the interest rate from r1 to r2, the quantity of goods and services demanded falls from Y1 to Y2.
