
Page 72 - The Principle of Economics
P. 72
72 PART TWO
SUPPLY AND DEMAND I: HOW MARKETS WORK
market demand curve. That is, to find the total quantity demanded at any price, we add the individual quantities found on the horizontal axis of the individual de- mand curves. Because we are interested in analyzing how markets work, we will work most often with the market demand curve. The market demand curve shows how the total quantity demanded of a good varies as the price of the good varies.
SHIFTS IN THE DEMAND CURVE
Suppose that the American Medical Association suddenly announces a new dis- covery: People who regularly eat ice cream live longer, healthier lives. How does this announcement affect the market for ice cream? The discovery changes peo- ple’s tastes and raises the demand for ice cream. At any given price, buyers now want to purchase a larger quantity of ice cream, and the demand curve for ice cream shifts to the right.
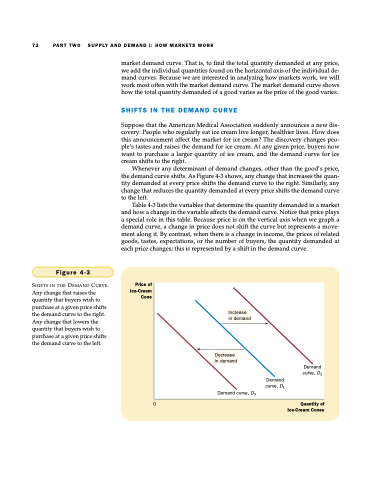
Whenever any determinant of demand changes, other than the good’s price, the demand curve shifts. As Figure 4-3 shows, any change that increases the quan- tity demanded at every price shifts the demand curve to the right. Similarly, any change that reduces the quantity demanded at every price shifts the demand curve to the left.
Table 4-3 lists the variables that determine the quantity demanded in a market and how a change in the variable affects the demand curve. Notice that price plays a special role in this table. Because price is on the vertical axis when we graph a demand curve, a change in price does not shift the curve but represents a move- ment along it. By contrast, when there is a change in income, the prices of related goods, tastes, expectations, or the number of buyers, the quantity demanded at each price changes; this is represented by a shift in the demand curve.
Figure 4-3
SHIFTS IN THE DEMAND CURVE. Any change that raises the quantity that buyers wish to purchase at a given price shifts the demand curve to the right. Any change that lowers the quantity that buyers wish to purchase at a given price shifts the demand curve to the left.
Price of Ice-Cream Cone
Increase in demand
Decrease in demand
Demand curve, D3
Demand curve, D1
Demand curve, D2
0
Quantity of Ice-Cream Cones
