
Page 752 - The Principle of Economics
P. 752
772 PART TWELVE
SHORT-RUN ECONOMIC FLUCTUATIONS
natural-rate hypothesis
the claim that unemployment eventually returns to its normal, or natural, rate, regardless of
the rate of inflation
account when setting wages and prices. The short-run Phillips curve then shifts to the right, as shown in the figure. The economy ends up at point C, with higher in- flation than at point A but with the same level of unemployment.
Thus, Friedman and Phelps concluded that policymakers do face a tradeoff be- tween inflation and unemployment, but only a temporary one. If policymakers use this tradeoff, they lose it.
THE NATURAL EXPERIMENT
FOR THE NATURAL-RATE HYPOTHESIS
Friedman and Phelps had made a bold prediction in 1968: If policymakers try to take advantage of the Phillips curve by choosing higher inflation in order to re- duce unemployment, they will succeed at reducing unemployment only tem- porarily. This view—that unemployment eventually returns to its natural rate, regardless of the rate of inflation—is called the natural-rate hypothesis. A few years after Friedman and Phelps proposed this hypothesis, monetary and fiscal policymakers inadvertently created a natural experiment to test it. Their labora- tory was the U.S. economy.
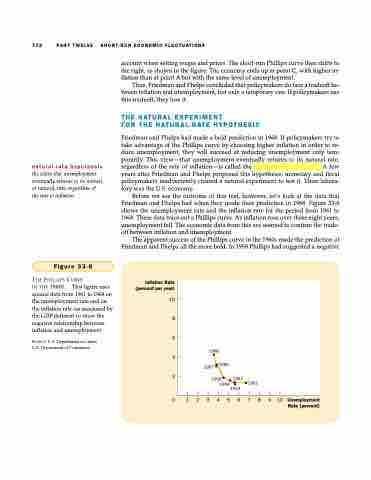
Before we see the outcome of this test, however, let’s look at the data that Friedman and Phelps had when they made their prediction in 1968. Figure 33-6 shows the unemployment rate and the inflation rate for the period from 1961 to 1968. These data trace out a Phillips curve. As inflation rose over these eight years, unemployment fell. The economic data from this era seemed to confirm the trade- off between inflation and unemployment.
The apparent success of the Phillips curve in the 1960s made the prediction of Friedman and Phelps all the more bold. In 1958 Phillips had suggested a negative
Figure 33-6
THE PHILLIPS CURVE
IN THE 1960S. This figure uses annual data from 1961 to 1968 on the unemployment rate and on the inflation rate (as measured by the GDP deflator) to show the negative relationship between inflation and unemployment.
SOURCE: U.S. Department of Labor; U.S. Department of Commerce.
Inflation Rate (percent per year)
10
8
6
4
2
0 1 2 3 4 5 6 7 8 9 10 Unemployment Rate (percent)
1968
1966
1967
1965 1962 1964
1961 1963
