
Page 76 - The Principle of Economics
P. 76
76 PART TWO SUPPLY AND DEMAND I: HOW MARKETS WORK
supply schedule
a table that shows the relationship between the price of a good and the quantity supplied
supply curve
a graph of the relationship between the price of a good and the quantity supplied
Table 4-4
BEN’S SUPPLY SCHEDULE. The supply schedule shows the quantity supplied at each price.
THE SUPPLY SCHEDULE AND THE SUPPLY CURVE
Consider how the quantity supplied varies with the price, holding input prices, technology, and expectations constant. Table 4-4 shows the quantity supplied by Ben, an ice-cream seller, at various prices of ice cream. At a price below $1.00, Ben does not supply any ice cream at all. As the price rises, he supplies a greater and greater quantity. This table is called the supply schedule.
Figure 4-5 graphs the relationship between the quantity of ice cream supplied and the price. The curve relating price and quantity supplied is called the supply curve. The supply curve slopes upward because, ceteris paribus, a higher price means a greater quantity supplied.
PRICEOFICE-CREAMCONE QUANTITYOFCONESSUPPLIED
$0.00 0 0.50 0 1.00 1 1.50 2 2.00 3 2.50 4 3.00 5
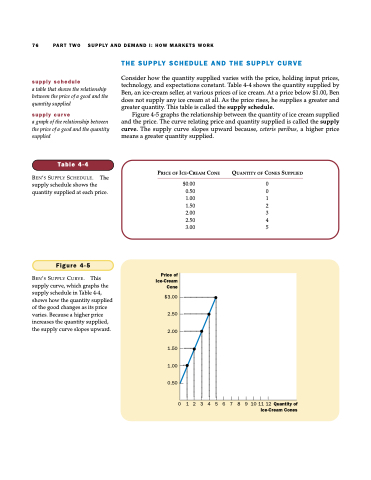
Figure 4-5
BEN’S SUPPLY CURVE. This supply curve, which graphs the supply schedule in Table 4-4, shows how the quantity supplied of the good changes as its price varies. Because a higher price increases the quantity supplied, the supply curve slopes upward.
Price of Ice-Cream Cone
$3.00
2.50
2.00
1.50
1.00
0.50
0 1 2 3 4 5 6 7 8 9 10 11 12 Quantity of Ice-Cream Cones
