
Page 761 - The Principle of Economics
P. 761
CHAPTER 33 THE SHORT-RUN TRADEOFF BETWEEN INFLATION AND UNEMPLOYMENT 781
1980 1981
A
1979
1984
1982
B
1987
C
1983 1985
1986
Inflation Rate (percent per year)
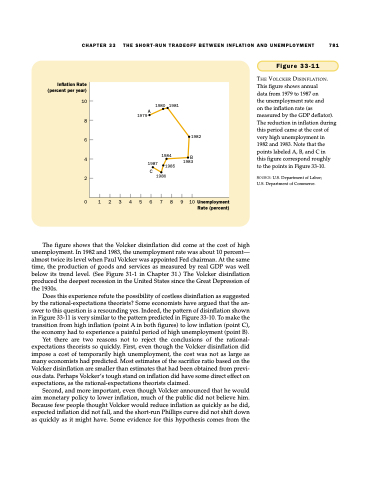
Figure 33-11
THE VOLCKER DISINFLATION. This figure shows annual data from 1979 to 1987 on
10 the unemployment rate and on the inflation rate (as
8
6
measured by the GDP deflator). The reduction in inflation during this period came at the cost of very high unemployment in 1982 and 1983. Note that the points labeled A, B, and C in
4 this figure correspond roughly to the points in Figure 33-10.
2
0 1 2 3 4 5 6 7 8 9 10Unemployment Rate (percent)
SOURCE: U.S. Department of Labor; U.S. Department of Commerce.
The figure shows that the Volcker disinflation did come at the cost of high unemployment. In 1982 and 1983, the unemployment rate was about 10 percent— almost twice its level when Paul Volcker was appointed Fed chairman. At the same time, the production of goods and services as measured by real GDP was well below its trend level. (See Figure 31-1 in Chapter 31.) The Volcker disinflation produced the deepest recession in the United States since the Great Depression of the 1930s.
Does this experience refute the possibility of costless disinflation as suggested by the rational-expectations theorists? Some economists have argued that the an- swer to this question is a resounding yes. Indeed, the pattern of disinflation shown in Figure 33-11 is very similar to the pattern predicted in Figure 33-10. To make the transition from high inflation (point A in both figures) to low inflation (point C), the economy had to experience a painful period of high unemployment (point B).
Yet there are two reasons not to reject the conclusions of the rational- expectations theorists so quickly. First, even though the Volcker disinflation did impose a cost of temporarily high unemployment, the cost was not as large as many economists had predicted. Most estimates of the sacrifice ratio based on the Volcker disinflation are smaller than estimates that had been obtained from previ- ous data. Perhaps Volcker’s tough stand on inflation did have some direct effect on expectations, as the rational-expectations theorists claimed.
Second, and more important, even though Volcker announced that he would aim monetary policy to lower inflation, much of the public did not believe him. Because few people thought Volcker would reduce inflation as quickly as he did, expected inflation did not fall, and the short-run Phillips curve did not shift down as quickly as it might have. Some evidence for this hypothesis comes from the
