
Page 666 - Excel 2013 All-in-One For Dummies
P. 666
648 Using Data Tables
In the data table in this example, you need to designate only B3 as the column input cell. (In the case of Figure 1-1, when you click this cell or use an arrow key to select this cell, Excel enters the absolute cell reference, as in $B$3.) You choose cell B3 because this is the cell that contains the growth rate value used in the master formula.
After indicating the row or column input cells, Excel computes the data table when you click the OK button. In this example, the program creates the data table by substituting each input value in the data series in the range B8:B17 into the column input cell B3. The value of cell B3 is then used in the master formula to calculate a new result, which is entered in the corresponding cell in the cell range C8:C17. After the program has finished calculating the data table, Excel returns the original value to the row or column input cell (in this case, 1.75% in cell B3).
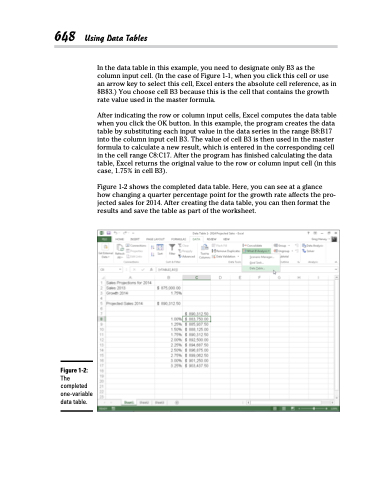
Figure 1-2 shows the completed data table. Here, you can see at a glance how changing a quarter percentage point for the growth rate affects the pro- jected sales for 2014. After creating the data table, you can then format the results and save the table as part of the worksheet.
Figure 1-2:
The completed one-variable data table.
