
Page 692 - Excel 2013 All-in-One For Dummies
P. 692
674 Creating Pivot Tables
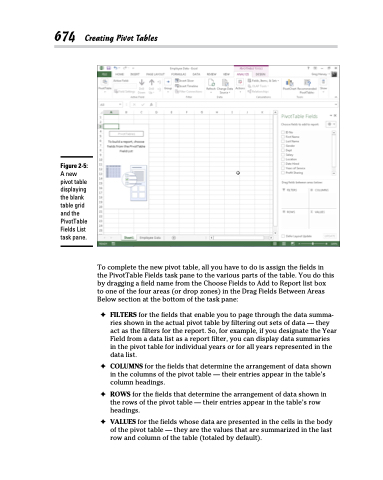
Figure 2-5:
A new pivot table displaying the blank table grid and the PivotTable Fields List task pane.
To complete the new pivot table, all you have to do is assign the fields in the PivotTable Fields task pane to the various parts of the table. You do this by dragging a field name from the Choose Fields to Add to Report list box
to one of the four areas (or drop zones) in the Drag Fields Between Areas Below section at the bottom of the task pane:
✦ FILTERS for the fields that enable you to page through the data summa- ries shown in the actual pivot table by filtering out sets of data — they act as the filters for the report. So, for example, if you designate the Year Field from a data list as a report filter, you can display data summaries in the pivot table for individual years or for all years represented in the data list.
✦ COLUMNS for the fields that determine the arrangement of data shown in the columns of the pivot table — their entries appear in the table’s column headings.
✦ ROWS for the fields that determine the arrangement of data shown in the rows of the pivot table — their entries appear in the table’s row headings.
✦ VALUES for the fields whose data are presented in the cells in the body of the pivot table — they are the values that are summarized in the last row and column of the table (totaled by default).
