
Page 13 - Annual Report
P. 13
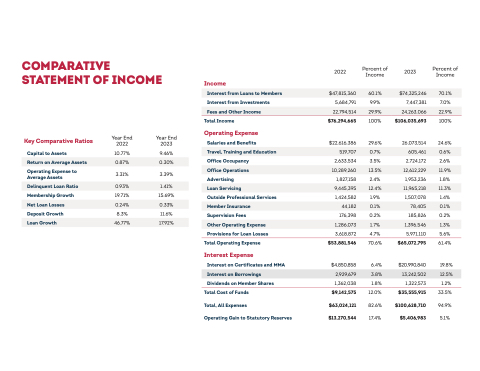
COMPARATIVE STATEMENT OF INCOME
2022
5,684,791
Salaries and Benefits
Office Occupancy
Advertising 1,827,158
Percent of Income
9.9%
29.6% 3.5% 2.4% 1.9% 0.2% 4.7%
6.4% 1.8%
82.6% 17.4%
2023
7,447,381
26,073,514 2,724,172 1,953,236 1,507,078 185,826 5,971,110
$20,990,840 1,322,573
$100,628,710 $5,406,983
Percent of Income
7.0%
24.6% 2.6% 1.8% 1.4% 0.2% 5.6%
19.8% 1.2%
94.9% 5.1%
 Interest from Loans to Members
$47,815,360
60.1%
$74,325,246
70.1%
Fees and Other Income
22,794,514
29.9%
24,263,066
22.9%
 Total Income
 $76,294,665
 100%
 $106,035,693
 100%
 Key Comparative Ratios
Capital to Assets
Operating Expense to Average Assets
Membership Growth Deposit Growth
$22,616,386 2,633,534
Year End 2022
10.77%
3.31%
19.71% 8.3%
Year End 2023
9.46%
3.39%
15.69% 11.6%
Income
Interest from Investments
Operating Expense
 Travel, Training and Education
519,707
0.7%
605,461
0.6%
 Return on Average Assets
0.87%
0.30%
Office Operations
10,289,260
13.5%
12,612,229
11.9%
Delinquent Loan Ratio
0.93%
1.41%
Loan Servicing
9,445,395
12.4%
11,965,218
11.3%
Outside Professional Services Supervision Fees
Provisions for Loan Losses
Interest Expense
Interest on Certificates and MMA Dividends on Member Shares
Total, All Expenses
Operating Gain to Statutory Reserves
1,424,582 176,398 3,618,872
$4,850,858 1,362,038
$63,024,121 $13,270,544
Net Loan Losses
0.24%
0.33%
Member Insurance
44,182
0.1%
78,405
0.1%
Loan Growth
46.77%
17.92%
Other Operating Expense
1,286,073
1.7%
1,396,546
1.3%
 Total Operating Expense
 $53,881,546
 70.6%
 $65,072,795
 61.4%
  Interest on Borrowings
2,929,679
3.8%
13,242,502
12.5%
 Total Cost of Funds
 $9,142,575
 12.0%
 $35,555,915
 33.5%
