
Page 103 - Algebra
P. 103
5.5. Graphing Exponential Functions
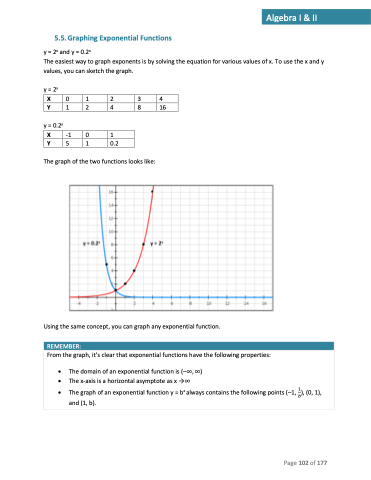
y = 2x and y = 0.2x
The easiest way to graph exponents is by solving the equation for various values of x. To use the x and y values, you can sketch the graph.
y = 2x X01234
Y 1 2 4 8 16 y = 0.2x
X -1 0 1
Y 5 1 0.2
The graph of the two functions looks like:
Using the same concept, you can graph any exponential function.
REMEMBER:
From the graph, it’s clear that exponential functions have the following properties:
• The domain of an exponential function is (–∞, ∞)
• The x-axis is a horizontal asymptote as x →∞
• The graph of an exponential function y = bx always contains the following points (–1, 1), (0, 1), 𝑏
and (1, b).
Page 102 of 177
Algebra I & II
