
Page 108 - Algebra
P. 108
Explanation:
1. Exponential decay is given by y = A(1 – r)x
Here A = $2000
r = 0.20
y = 2000(1 – 0.20)x y = 2000(0.80)x
X0123
Y
2000 1600 1280 1024
Graph 3 is the correct answer.
Put x = 0 in – 3(1.5)x
f(x)=–3(1.5)0 =–3
When x = 0, the value of y or f(x) = – 3
So, you can rule out Graph 1 and Graph 2 because when x = 0, y = 1
Similarly, for graph 4, when x = 0, the value of y = – 2. So, graph 4 is also not the answer. Now look at graph 3, when x = 0, the value of y = – 3. So, graph 3 is the graph for y = – 3(1.5)x
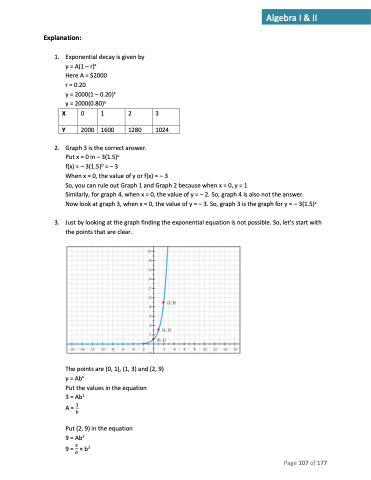
Just by looking at the graph finding the exponential equation is not possible. So, let’s start with the points that are clear.
The points are (0, 1), (1, 3) and (2, 9) y = Abx
Put the values in the equation
3 = Ab1
A=3 𝑏
Put (2, 9) in the equation 9 = Ab2
9 = 3 × b2 𝑏
2.
3.
Page 107 of 177
Algebra I & II
