
Page 9 - Regression Guideline for AMC
P. 9
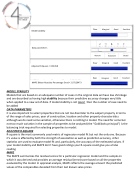
Model stability
Data parameters
Adjusted R-‐Square = 0.86158
MAPE (Mean Absolute Percentage Error)= 2.07129473
Poor Marginal Good Excellent
-‐2 -‐1 0 1 2
Narrow Balanced Poor Marginal Good
Poor Marginal Good
Broad Excellent
Excellent
MODEL STABILITY
Models that are based on an adequate number of cases in the original data set have low shrinkage and are described as having high stability because their predic6ve accuracy changes very li.le when applied to a new set of data. If model stability is not Good then the number of case need to be added
DATA PARAMETERS
It is also important to select proper6es that are not too dissimilar to the subject property in terms of the range of sales prices, year of construc6on, loca6on and other property characteris6cs although we do need some varia6on, otherwise there is nothing to model. The need for some but not too much varia6on in the sample of proper6es to be analyzed (the “Goldilocks principal”) is the balancing trick required for selec6ng proper6es to model.
ADJUSTED R-‐SQUARE
R-‐square is the most commonly used metric of regression model fit but not the only one. Because it’s value is affected by both the strength of associa6on as well as predic6on accuracy, other sta6s6cs are used to evaluate model fit and, par6cularly, the accuracy of the es6mated values. If your model stability and MAPE don’t have good ra6ngs your R-‐square could give you a false reading
MAPE
The MAPE summarizes the residual scores for a par6cular regression model and the sample on which it was derived and provides an average residual (error)score based on all the proper6es evaluated by the model. In appraisal analysis, MAPE reflects the average amount the predicted values of the comparables deviated from their last known sales prices
