
Page 15 - WTM Cities Report
P. 15
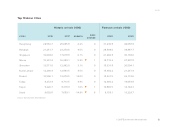
Top 10 Asian Cities
9,318.9 7,659.1
1.0%  1 -14.9%  6
10,865.5 9,159.1
0 28,509.6 0 21,266.9
ASIA
Historic arrivals ('000)
Forecast arrivals (‘000)
cities
2016
2017
growth
rank change
2020
2025
Hong Kong
Bangkok Singapore Macau Shenzhen Kuala Lumpur Phuket
26,552.7
21,251.7 16,604.0 15,391.9 12,571.0 12,290.4 10,596.1
25,695.8 -3.2%
23,270.6 9.5%
17,618.8 6.1%
16,299.1 5.9%  1 19,715.2
0 31,230.8
44,058.9
39,887.7 30,194.0 27,907.8 20,504.1 21,251.4 22,119.6 14,654.8 14,144.3 13,229.7
Tokyo 9,272.9 Taipei 9,226.7 Seoul 9,002.8
Source: Euromonitor International
12,962.0 3.1% 12,843.5 4.5% 12,079.5 14.0%
9,713.5 4.8%
0 15,331.8 0 15,382.2 0 15,321.5 0 12,366.2
© 2017 Euromonitor International 12
