
Page 121 - NIB Annual Report 12-13 | 13-14
P. 121
TURKS AND CAICOS ISLANDS NATIONAL INSURANCE BOARD
Notes to Financial Statements, continued Year ended March 31, 2014
4. Determination of fair values, continued
The values derived from applying these techniques are significantly affected by the underlying assumptions used concerning both the amounts and timing of future cash flows and the discount rates.
The following methods and assumptions have been used:
The fair value of liquid assets and other assets maturing within one year is assumed to approximate their carrying amount. This assumption is applied to liquid assets and the short-term elements of all other financial assets and financial liabilities; and
The fair value of variable-rate financial instruments is assumed to approximate their carrying amounts.
(a) Available-for-sale financial assets
The fair value of available-for-sale financial assets is determined by reference to their quoted closing bid price at the reporting date.
(b) Investment in, and assets held with, TCI Bank
The fair value of NIB’s investment in TCI Bank was assessed by NIB’s management to be US$nil at March 31, 2014 and March 31, 2013 as a consequence of TCI Bank entering provisional liquidation on April 9, 2010 and liquidation on October 29, 2010. The fair value of NIB’s other, non-secured, assets held with TCI Bank were reduced by 56% of the total amounts held at the date TCI Bank entered provisional liquidation, being management’s best estimate of an appropriate fair value adjustment in the circumstances.
(c) Loans and receivables
With the exception of assets held with TCI Bank the fair value of loans and receivables is estimated as the present value of future cash flows, discounted at the market rate of interest at the reporting date. The fair value of assets held with TCI Bank has been estimated by NIB’s management.
(d) Other financial instruments
Due to their short-term nature the carrying amounts of other financial assets and liabilities of NIB approximate their fair value.
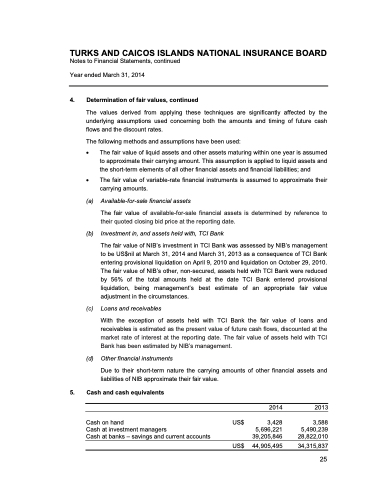
5. Cash and cash equivalents
Cash on hand
Cash at investment managers
Cash at banks – savings and current accounts
US$ US$
2014
3,428 5,696,221 39,205,846
2013
3,588 5,490,239 28,822,010
44,905,495
34,315,837
2013 & 2014 ANNUAL REPORT | 117 25
