
Page 125 - NIB Annual Report 12-13 | 13-14
P. 125
TURKS AND CAICOS ISLANDS NATIONAL INSURANCE BOARD
Notes to Financial Statements, continued Year ended March 31, 2014
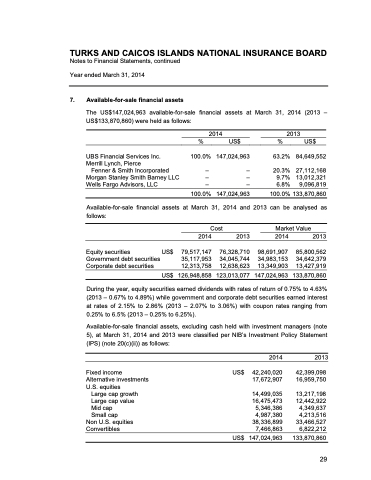
7. Available-for-sale financial assets
The US$147,024,963 available-for-sale financial assets at March 31, 2014 (2013 – US$133,870,860) were held as follows:
2014 2013
% US$ % US$
UBS Financial Services Inc. Merrill Lynch, Pierce
Fenner & Smith Incorporated Morgan Stanley Smith Barney LLC Wells Fargo Advisors, LLC
100.0% 147,024,963
– – – – – –
100.0% 147,024,963
63.2%
20.3% 9.7% 6.8%
100.0%
84,649,552
27,112,168 13,012,321 9,096,819
133,870,860 analysed as
Available-for-sale financial assets at March 31, 2014 and 2013 can be follows:
Equity securities US$ Government debt securities Corporate debt securities
79,517,147 35,117,953 12,313,758
2013
76,328,710 34,045,744 12,638,623
2013
85,800,562 34,642,379 13,427,919
Cost 2014
Market Value 2014
98,691,907 34,983,153 13,349,903
US$ 126,948,858 123,013,077 147,024,963 133,870,860
During the year, equity securities earned dividends with rates of return of 0.75% to 4.63% (2013 – 0.67% to 4.89%) while government and corporate debt securities earned interest at rates of 2.15% to 2.86% (2013 – 2.07% to 3.06%) with coupon rates ranging from 0.25% to 6.5% (2013 – 0.25% to 6.25%).
Available-for-sale financial assets, excluding cash held with investment managers (note 5), at March 31, 2014 and 2013 were classified per NIB’s Investment Policy Statement (IPS) (note 20(c)(ii)) as follows:
Fixed income Alternative investments U.S. equities
Large cap growth Large cap value Mid cap
Small cap
Non U.S. equities Convertibles
US$
2014
42,240,020 17,672,907
14,499,035 16,475,473 5,346,386 4,987,380 38,336,899 7,466,863
2013
42,399,098 16,959,750
13,217,198 12,442,922 4,349,637 4,213,516 33,466,527 6,822,212
133,870,860
US$ 147,024,963
2013 & 2014 ANNUAL REPORT | 121 29
