
Page 135 - NIB Annual Report 12-13 | 13-14
P. 135
TURKS AND CAICOS ISLANDS NATIONAL INSURANCE BOARD
Notes to Financial Statements, continued Year ended March 31, 2014
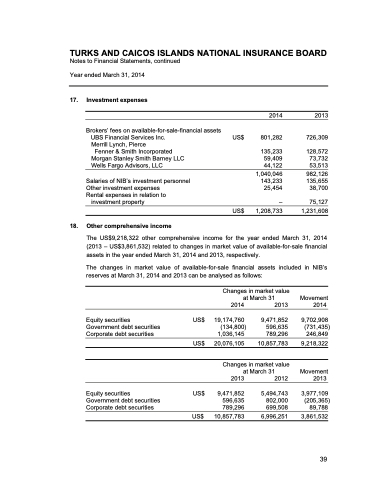
17. Investment expenses
Brokers’ fees on available-for-sale-financial assets UBS Financial Services Inc.
Merrill Lynch, Pierce
Fenner & Smith Incorporated Morgan Stanley Smith Barney LLC Wells Fargo Advisors, LLC
Salaries of NIB’s investment personnel Other investment expenses
Rental expenses in relation to
investment property
18. Other comprehensive income
US$
US$
2014
801,282
135,233 59,409 44,122
1,040,046 143,233 25,454
– 1,208,733
2013
726,309
128,572 73,732 53,513
982,126 135,655 38,700
75,127 1,231,608
The US$9,218,322 other comprehensive income for the year ended March 31, 2014 (2013 – US$3,861,532) related to changes in market value of available-for-sale financial assets in the year ended March 31, 2014 and 2013, respectively.
The changes in market value of available-for-sale financial assets included in NIB’s reserves at March 31, 2014 and 2013 can be analysed as follows:
Equity securities Government debt securities Corporate debt securities
Equity securities Government debt securities Corporate debt securities
US$
2014
19,174,760 (134,800)
2013
9,471,852 596,635 789,296
Changes in market value at March 31
Movement 2014
9,702,908 (731,435)
246,849 9,218,322
Movement 2013
3,977,109 (205,365)
89,788 3,861,532
1,036,145
US$ 20,076,105 10,857,783
Changes in market value at March 31
2013
2012
US$
US$ 10,857,783 6,996,251
9,471,852 596,635 789,296
5,494,743 802,000 699,508
2013 & 2014 ANNUAL REPORT | 131 39
