
Page 15 - NIB Annual Report 12-13 | 13-14
P. 15
Operations
Financing National Insurance
The TCI National Insurance Fund (NIF) is relatively young and will soon be going through a period of rapid increase in the number of pensioners and the amount of pensions that will be paid. It is projected to reach a state of maturity within the next 50 to 60 years as the pay as you go rate and ratio of contributors to pensioners start to stabilize.
The NIB sources of income to fund benefits comes from contributions received from employees, employers, self employed persons, investment earnings on the reserves and penalty charges (also referred to as surcharges). The penalty charges are relatively small and have minimal impact on Total Fund Income. All insured persons and employees between the ages of 16 and 65 who are gainfully employed, are required to contribute to the plan. The program provides a wide range of benefits including various pensions, grants and payments.
The average unemployment rate for the period 2001 to 2008 was 7.8%, but in recent years the average unemployment rate has grown significantly reaching 17.2% in the fiscal year 2012/13. These high levels of unemployment have lead to a significant decrease in the employed population, directly affecting the number of active contributors and the contribution earnings base of the NIB.
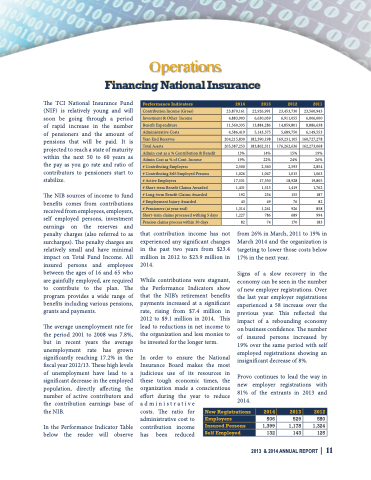
In the Performance Indicator Table below the reader will observe
23,870,161
4,883,903
11,560,335
4,586,419
204,215,830
205,387,253
13%
19%
2,500
1,026
17,531
1,431
192
43
1,314
1,227
82
22,926,991
6,630,039
13,884,286
5,143,575
182,390,198
183,862,311
14%
22%
2,560
1,047
17,550
1,515
234
49
1,261
786
74
23,453,730
6,911,055
14,859,801
5,689,750
169,231,105
176,262,636
15%
24%
2,593
1,015
18,928
1,419
155
76
926
689
170
23,560,943 6,006,000 8,886,638 6,149,553
160,727,278 162,273,068 19% 26% 2,854 1,063 19,805 1,762 187 82 858 994 183
Performance Indicators
2014
2013
2012
2011
Contribution Income (Gross)
Investment & Other Income
Benefit Expenditure
Administrative Costs
Year-End Reserves
Total Assets
Admin cost as a % Contribution & Benefit
Admin Cost as % of Cont. Income
# Contributing Employers
# Contributing Self-Employed Persons
# Active Employees
# Short-term Benefit Claims Awarded
# Long-term Benefit Claims Awarded
# Employment Injury Awarded
# Pensioners (at year-end)
Short-term claims processed withing 5 days
Pension claims process within 30 days
that contribution income has not experienced any significant changes in the past two years from $23.4 million in 2012 to $23.9 million in 2014.
While contributions were stagnant, the Performance Indicators show that the NIB’s retirement benefits payments increased at a significant rate, rising from $7.4 million in 2012 to $9.1 million in 2014. This lead to reductions in net income to the organization and less monies to be invested for the longer term.
In order to ensure the National Insurance Board makes the most judicious use of its resources in these tough economic times, the organization made a conscientious effort during the year to reduce administrative
costs. The ratio for administrative cost to contribution income has been reduced
from 26% in March, 2011 to 19% in March 2014 and the organization is targeting to lower those costs below 17% in the next year.
Signs of a slow recovery in the economy can be seen in the number of new employer registrations. Over the last year employer registrations experienced a 58 increase over the previous year. This reflected the impact of a rebounding economy on business confidence. The number of insured persons increased by 19% over the same period with self employed registrations showing an insignificant decrease of 8%.
Provo continues to lead the way in new employer registrations with 81% of the entrants in 2013 and 2014.
506 529 580
1,399 1,178 1,324
132 143 125
New Registrations
2014
2013
2012
Employers
Insured Persons
Self Employed
2013 & 2014 ANNUAL REPORT | 11
