
Page 37 - NIB Annual Report 12-13 | 13-14
P. 37
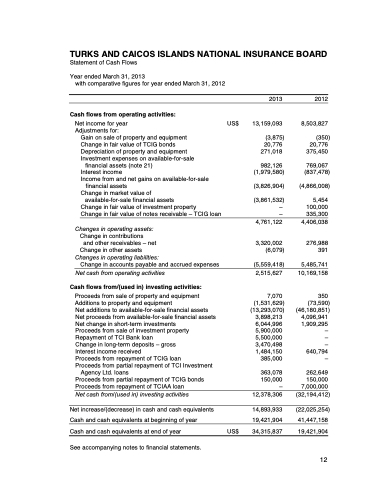
 TURKS AND CAICOS ISLANDS NATIONAL INSURANCE BOARD
Statement of Cash Flows
Year ended March 31, 2013
with comparative figures for year ended March 31, 2012
Cash flows from operating activities:
Net income for year Adjustments for:
Gain on sale of property and equipment Change in fair value of TCIG bonds Depreciation of property and equipment Investment expenses on available-for-sale
financial assets (note 21)
Interest income
Income from and net gains on available-for-sale
financial assets
Change in market value of
available-for-sale financial assets
Change in fair value of investment property
Change in fair value of notes receivable – TCIG loan
Changes in operating assets:
Change in contributions
and other receivables – net
Change in other assets
Changes in operating liabilities:
Change in accounts payable and accrued expenses
Net cash from operating activities
Cash flows from/(used in) investing activities:
Proceeds from sale of property and equipment Additions to property and equipment
Net additions to available-for-sale financial assets Net proceeds from available-for-sale financial assets Net change in short-term investments
Proceeds from sale of investment property Repayment of TCI Bank loan
Change in long-term deposits – gross Interest income received
Proceeds from repayment of TCIG loan
Proceeds from partial repayment of TCI Investment
Agency Ltd. loans
Proceeds from partial repayment of TCIG bonds Proceeds from repayment of TCIAA loan
Net cash from/(used in) investing activities
Net increase/(decrease) in cash and cash equivalents Cash and cash equivalents at beginning of year
Cash and cash equivalents at end of year
See accompanying notes to financial statements.
US$
2013
13,159,093
(3,875) 20,776 271,018
982,126 (1,979,580)
(3,826,904)
(3,861,532) –
– 4,761,122
3,320,002 (6,079)
(5,559,418) 2,515,627
7,070 (1,531,629) (13,293,070)
3,898,213 6,044,996 5,900,000 5,500,000 3,470,498 1,484,150
385,000
363,078 150,000 – 12,378,306
14,893,933 19,421,904 34,315,837
2012
8,503,827
(350) 20,776 375,450
769,067 (837,478)
(4,866,008)
5,454 100,000 335,300 4,406,038
276,988 391
5,485,741 10,169,158
350 (73,590) (46,180,851)
4,096,941 1,909,295 – – – 640,794 –
262,649
150,000 7,000,000
(32,194,412)
(22,025,254) 41,447,158 19,421,904
       US$
 2013 & 2014 ANNUAL REPORT | 33 12
