
Page 127 - Demo
P. 127
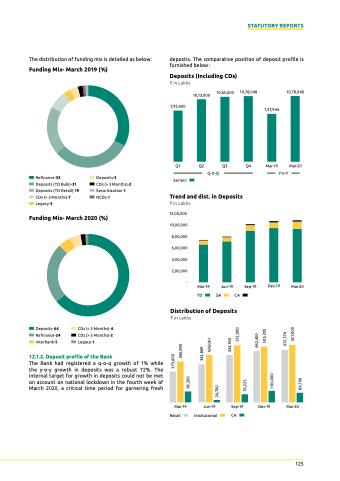
The distribution of funding mix is detailed as below:
Funding Mix- March 2019 (%)
deposits. the comparative position of deposit profile is furnished below :
deposits (including cds)
` in Lakhs
10,13,000
7,95,600
Q1 Q2 Series1
10,65,600
Q3
10,78,048
Q4
7,37,944
Mar-19
10,78,048
Mar-20
STATUTORY REPORTS
            Refinance-33
Deposits (TD Bulk)-31 Deposits (TD Retail)-19 CDs (< 3 Months)-7 Legacy-3
Deposits-3
CDs (> 3 Months)-2 Securitization-1 NCDs-1
Q-0-Q
Y-0-Y
          Funding Mix- March 2020 (%)
trend and dist. in deposits
` in Lakhs 12,00,000
10,00,000 8,00,000 6,00,000 4,00,000 2,00,000
-
TD SA CA
distribution of deposits
` in Lakhs
               Mar-19 Jun-19
Sep-19 Dec-19
Mar-20
   Deposits-64 Refinance-24 Interbank-5
CDs (< 3 Months)-4 CDs (> 3 Months)-2 Legacy-1
           12.1.2. Deposit profile of the bank
The Bank had registered a q-o-q growth of 1% while the y-o-y growth in deposits was a robust 72%. The internal target for growth in deposits could not be met on account on national lockdown in the fourth week of March 2020, a critical time period for garnering fresh
          Mar-19 Jun-19 Sep-19
Dec-19
Mar-20
Retail
Institutional CA
    125
24,700
98,200
76,225
100,000
84,700
273,600 365,800
342,869 428,061
424,760 512,000
462,400 503,200
472,374 521,000
