
Page 133 - Demo
P. 133
Particulars
net profit Operating Expenses
Provisions and Contingencies
Gross Income
Average (3 years)
686 65,287
31,276
97,249
19,922 100,335
10,980
131,237 141,356
(` in Lakhs)
(387) 387
- -
(387) 387
Mar-18
Mar-19
` in Lakhs
Mar-20
STATUTORY REPORTS
13.2. Quantitative disclosure
The Bank follows the BIA approach to compute its Operational Risk capital charge and RWA. The detailed computation is as follows:
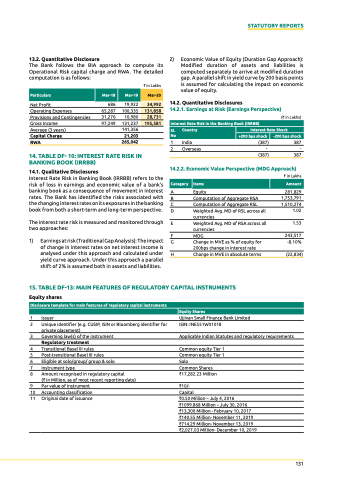
2) Economic Value of Equity (Duration Gap Approach): Modified duration of assets and liabilities is computed separately to arrive at modified duration gap. A parallel shift in yield curve by 200 basis points is assumed for calculating the impact on economic value of equity.
14.2. Quantitative disclosures
14.2.1. earnings at risk (earnings Perspective)
34,992
131,858
28,731
195,581
interest rate risk in the banking book (irrbb)
sl. no
country
interest rate shock
+200 bps shock
-200 bps shock
capital charge
rWa 265,042
14. Table DF- 10: inTereST raTe riSk in bankinG book (irrbb)
14.1. Qualitative disclosures
21,203
1 India
2 Overseas
Interest Rate Risk in Banking Book (IRRBB) refers to the risk of loss in earnings and economic value of a bank’s banking book as a consequence of movement in interest rates. the Bank has identified the risks associated with the changing interest rates on its exposures in the banking book from both a short-term and long-term perspective.
The interest rate risk is measured and monitored through two approaches:
1) Earnings at risk (Traditional Gap Analysis): The impact of change in interest rates on net interest income is analysed under this approach and calculated under yield curve approach. Under this approach a parallel shift of 2% is assumed both in assets and liabilities.
14.2.2. economic value Perspective (Mdg approach)
` in Lakhs
A Equity 281,829
B Computation of Aggregate RSA 1,753,791
C Computation of Aggregate RSL 1,510,274
D Weighted Avg. MD of RSL across all 1.02 currencies
E Weighted Avg. MD of RSA across all 1.53 currencies
F MDG 243,517
category
items
amount
G Change in MVE as % of equity for 200bps change in interest rate
H Change in MVE in absolute terms
-8.10% (22,834)
15. Table DF-13: Main FeaTureS oF reGulaTory caPiTal inSTruMenTS
equity shares
1 Issuer
2 unique identifier (e.g. CuSIp, ISIn or Bloomberg identifier for private placement)
3 Governing law(s) of the instrument
regulatory treatment
4 Transitional Basel III rules
5 Post-transitional Basel III rules
6 Eligible at solo/group/ group & solo
7 Instrument type
8 Amount recognised in regulatory capital
(` in Million, as of most recent reporting date)
9 Par value of instrument
10 Accounting classification
11 Original date of issuance
Ujjivan Small Finance Bank Limited ISIN: INE551W01018
Applicable Indian Statutes and regulatory requirements
Common equity Tier 1 Common equity Tier 1 Solo
Common Shares `17,282.23 Million
`10/-
Capital
`0.50 Million – July 4, 2016 `1099.868 Million – July 30, 2016 `13,300 Million - February 10, 2017 `140.55 Million- November 11, 2019 `714.29 Million- November 13, 2019 `2,027.03 Million- December 10, 2019
disclosure template for main features of regulatory capital instruments
equity shares
131
