
Page 8 - Mellby Gård Yearbook 2018–2019
P. 8
OUR RESULTS
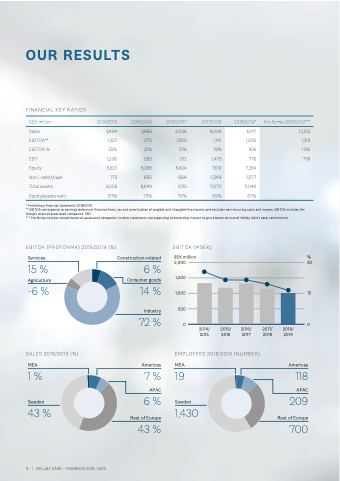
FINANCIAL KEY RATIOS
SEK million 2014/2015
Sales 5,494 EBITDA** 1,357 EBITDA % 25% EBT 1,206 Equity 5,523 Net (–debt)/cash
Total assets Equity/assets ratio
2015/2016
2016/2017 2017/2018
6,056 6,009 1,300 1,141 21% 19% 1,113 1,475 6,424 7,619 -564 -1,249 9,115 11,070 70% 69%
2018/2019*
Pro forma 2018/2019***
13,512 1,319 10% 776
6,147
1,005
16%
776
7,384
-1,277
11,046
67%
5,685 1,173 21% 1,185 6,298 173 655 8,208 8,649 67% 73%
* Preliminary financial statements 2018/2019 .
** EBITDA corresponds to earnings before net financial items, tax and amortization of tangible and intangible fixed assets and excludes non-recurring costs and income . EBITDA includes the Group’s share of associated companies’ EBT .
*** Pro forma includes consolidation of associated companies’ income statements corresponding to ownership interest to give a better picture of Mellby Gård’s total commitment .
EBITDA (PROFORMA) 2018/2019 (%)
Services
15 %
Agriculture
-6%
SALES 2018/2019 (%)
MEA
1 %
Sweden
43 %
EBITDA (MSEK)
SEK million % 2,000 30
1,500
14% 1,000 15
Construction-related
6 %
Consumer goods
8
|
|
M
M
E
EL
LL
LB
BY
YG
GÅ
Å
R
RD
D
-
–
Y
Y
E
E
A
A
R
R
B
B
O
O
O
O
K
K
2
2
0
0
1
1
8
8
/
/
2
2
0
0
1
1
9
9
Industry
72%
Americas
500 00
2014/ 2015/ 2016/ 2015 2016 2017
EMPLOYEES 2018/2019 (NUMBER)
MEA
2017/ 2018
2018/ 2019
Americas
118
APAC
209
7 % 19
APAC
6 %
Sweden
1,430
43% 700
Rest of Europe
Rest of Europe
8
