
Page 16 - ANZCP Gazette April 2021
P. 16
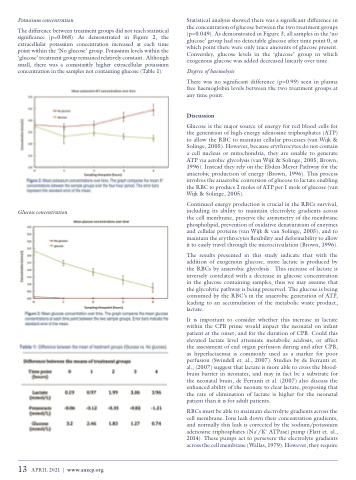
Potassium concentration
The difference between treatment groups did not reach statistical significance (p=0.068). As demonstrated in Figure 2, the extracellular potassium concentration increased at each time point within the ‘No glucose’ group. Potassium levels within the ‘glucose’ treatment group remained relatively constant. Although small, there was a consistantly higher extracellular potassium concentration in the samples not containing glucose (Table 1).
Glucose concentration
Statistical analysis showed there was a significant difference in the concentration of glucose between the two treatment groups (p=0.049). As demonstrated in Figure 3, all samples in the ‘no glucose’ group had no detectable glucose after time point 0, at which point there were only trace amounts of glucose present. Conversley, glucose levels in the ‘glucose’ group in which exogenous glucose was added decreased linearly over time.
Degree of haemolysis
There was no significant difference (p=0.99) seen in plasma free haemoglobin levels between the two treatment groups at any time point.
Discussion
Glucose is the major source of energy for red blood cells for the generation of high-energy adenosine triphosphates (ATP) to allow the RBC to maintain cellular processes (van Wijk & Solinge, 2005). However, because erythrocytes do not contain a cell nucleus or mitochondria, they are unable to generate ATP via aerobic glycolysis (van Wijk & Solinge, 2005; Brown, 1996). Instead they rely on the Ebden-Meyer Pathway for the anaerobic production of energy (Brown, 1996). This process involves the anaerobic conversion of glucose to lactate enabling the RBC to produce 2 moles of ATP per 1 mole of glucose (van Wijk & Solinge, 2005).
Continued energy production is crucial in the RBCs survival, including its ability to maintain electrolyte gradients across the cell membrane, preserve the asymmetry of the membrane phospholipid, prevention of oxidative denaturation of enzymes and cellular proteins (van Wijk & van Solinge, 2005), and to maintain the erythrocytes flexibility and deformability to allow it to easily travel through the microcirculation (Brown, 1996).
The results presented in this study indicate that with the addition of exogenous glucose, more lactate is produced by the RBCs by anaerobic glycolysis. This increase of lactate is inversely correlated with a decrease in glucose concentration in the glucose containing samples, thus we may assume that the glycolytic pathway is being preserved. The glucose is being consumed by the RBC’s in the anaerobic generation of ATP, leading to an accumulation of the metabolic waste product, lactate.
It is important to consider whether this increase in lactate within the CPB prime would impact the neonatal on infant patient at the onset, and for the duration of CPB. Could this elevated lactate level attenuate metabolic acidosis, or affect the assessment of end organ perfusion during and after CPB, as hyperlactaemia is commonly used as a marker for poor perfusion (Swindell et. al., 2007). Studies by de Ferranti et. al., (2007) suggest that lactate is more able to cross the blood- brain barrier in neonates, and may in fact be a substrate for the neonatal brain, de Ferranti et al. (2007) also discuss the enhanced ability of the neonate to clear lactate, proposing that the rate of elimination of lactate is higher for the neonatal patient than it is for adult patients.
RBCs must be able to maintain electrolyte gradients across the cell membrane. Ions leak down their concentration gradients, and normally this leak is corrected by the sodium/potassium adenosine triphosphates (Na+/K+ ATPase) pump (Flatt et. al., 2014). These pumps act to persevere the electrolyte gradients across the cell membrane (Wallas, 1979). However, they require
      13 APRIL 2021 | www.anzcp.org
