
Page 12 - CoP_Infrastructure_Plan_2017
P. 12
COMMUNITY INFRASTRUCTURE PLAN / Community Pro le and Popula on Trends
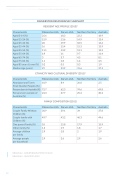
PALMERSTON DEMOGRAPHIC SNAPSHOT
RESIDENT AGE PROFILE (2013)3
Characteris c
Palmerston LGA
Darwin LGA
Northern Territory
Australia
Aged 0-14 (%)
25.6
18.3
22.3
Aged 15-24 (%)
Aged 25-34 (%)
15.9
13.6
14.9
20
19.9
18.5
Aged 35-44 (%)
16
15.4
15.3
Aged 45-54 (%)
Aged 55-64 (%)
11.1
13.9
13.1
6.9
11
9.7
Aged 65-74 (%)
3
5.7
4.5
Aged 75-84 (%)
1.1
1.8
1.4
Aged 85 years & over (%)
0.2
0.5
0.3
Median Age (years)
29
33.9
31.6
ETHNICITY AND CULTURAL DIVERSITY (2011)4
FAMILY COMPOSITION (2011)
18.9 13.4 14.6 13.9 13.3 11.4 8.1 4.5 1.9 37.3
2.5
69.8 30.2
37.8
44.6
15.9 1.7 1.9
2.6
Characteris c
Aboriginal and Torres Strait Islander Peoples (%)
Palmerston LGA
Darwin LGA
Northern Territory
Australia
10.9
8.4
26.8
Persons born in Australia (%)
75.7
62.3
74.6
Persons born outside of Australia (%)
24.3
37.7
25.4
Characteris c
Palmerston LGA
Darwin LGA
Northern Territory
Australia
Couple Family Without Children (%)
30.9
39.1
34
Couple family with Children (%)
49.7
43.2
46.3
One parent Family (%)
18
15.8
17.9
Other family (%)
1.3
1.9
1.8
Average children per family
2.9
1.8
2
Average people per household
2.9
2.6
2.9
3ABS.GOV.AU – DATA BY REGION STATISTICS (2013) 4ABS.GOV.AU – QUICKSTATS (2011)
12
