
Page 105 - MYM 2016
P. 105
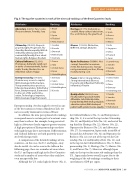
fig. 3: the top  ve countries in each of the nine sub-rankings of the best countries study
sPotlight oN braNDiNg
attributes
ranking
adventure (3.24%): Fun, Scenic, Pleasant climate, Friendly, Sexy
1. Brazil
2. Italy
3. Spain
4. Thailand
5. New Zealand
citizenship (16.95%): Respects property rights, Progressive, Tru- stworthy, Gender equality, Well-di- stributed political power, Envi- ronmentally friendly, Cares about human rights, Religious freedom
1. Sweden
2. Canada
3. Denmark
4. Netherlands 5. Australia
cultural in uence (12.93%): Prestigious, Culturally signi cant in terms of entertainment, Fashio- nable, Trendy, Modern, Has an in uential culture, Happy
1. France
2. Italy
3. United States
4. Spain
5. United Kingdom
entrepreneurship (17.42%): Provides easy access to capital, Well-developed infrastructure, Transparent business practices, Educated population, Skilled labor force, Entrepreneurial, Connected to the rest of the world, Inno- vative, Technological expertise, Well-developed legal framework
1. Germany
2. Japan
3. United States
4. United Kingdom 5. Canada
attributes
ranking
heritage (3.17%): Culturally ac- cessible, Many cultural attractions, Has a rich history, Has great food
1. Italy
2. Spain 3. Greece 4. France 5. Mexico
Movers (11.99%): Distinctive, Di erent, Unique, Dynamic
1. India
2. Singapore 3. China
4. Thailand 5. Japan
open for business (10.00%): Not corrupt, Favorable tax environ- ment, Not bureaucratic, Transpa- rent government practices, Cheap manufacturing costs
1. Luxembourg 2. Sweden
3. Canada
4. Denmark
5. Panama
Power (7.42%): Strong military, Strong international alliances, Economically in uential, Politically in uential, A leader
1. United States 2. Russia
3. China
4. Germany
5. United Kingdom
Quality of life (16.89%): Econo- mically stable, A good job market, A ordable, Safe, Politically stable, Family friendly, Well-developed public education system, Well-developed public health system, Income equality
1. Canada
2. Sweden
3. Denmark
4. Australia
5. Netherlands
Entrepreneurship. Sweden might be viewed as one of the best nations in terms of Quality of Life, yet not necessarily dominant in terms of Power.
In addition, the nine perceptional sub-rankings correspond more to certain parts of a nation’s econ- omy than to others. For example, being perceived high in Adventure clearly supports greater tourism. A high perception of Entrepreneurship correlates with high foreign direct investment. Di erentiation and Cultural In uence are both positively associ- ated with foreign trade.
A comparison of the detailed rankings of two countries—in this case, the U.S. and Japan—may also be useful. As can be seen in the table on the following page, there are a number of areas where the U.S. and Japan rank high in the Best Countries study and a number of areas where they rank low, even unexpectedly low:
Although the U.S. ranks high for Power (No. 1),
for Cultural In uence (No. 3), and Entrepreneur- ship (No. 3), it is out of the top ten for Citizenship (No. 11) and Quality of Life (No. 14), and out of the top third for Heritage (No. 22), Movers (No. 22), Openness for Business (No. 23), and Adventure (No. 27). In comparison, Japan ranks in middle of the pack for Adventure (No. 32) and Openness for Business (No. 22), just out of the top ten for Citi- zenship (No. 14) and Quality of Life (No. 11), and in the top ten for Cultural In uence (No. 6), Entre- preneurship (No. 2), Heritage (No. 7), Movers (No. 5), and Power (No. 7). However, although Japan ranks in the top ten for more sub-rankings than the U.S., Japan ranks lower overall, in part due to the weighting of the sub-rankings according to their correlation to GDP per capita.
OCTOBEr 2016 MINd YOUr MarkETING | 105
