
Page 57 - Sustainability report 2018 Ratti Group
P. 57
consumption of methane on the Italian site, with the latest generation of burners that have inverters and oxygen probes. The new burners guarantee emissions of NOX<120 μg/m3;
• Theair-conditioningsystemwasreplacedin
the building used for printing, switching from
a system which used superheated water to one using hot water. The new plant will improve heat exchange efficiency and will be suitable, in the future, for integration with a cogeneration plant.;
• Theair-conditioningsystemintheweaving building was replaced with new machines that use the gas R1234z and with Global Warming Potential (the measurement of the contribution a gas makes to the greenhouse effect) that is negligible in comparison with traditional HFC refrigerants.
Energy consumption
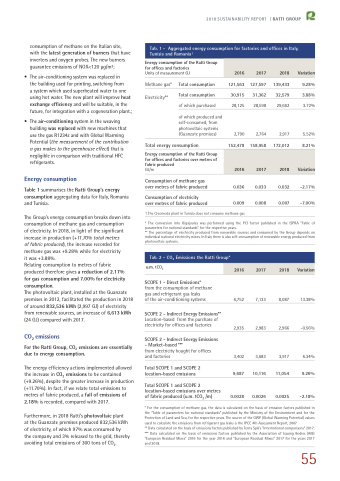
Table 1 summarises the Ratti Group’s energy consumption aggregating data for Italy, Romania and Tunisia.
The Group’s energy consumption breaks down into consumption of methane gas and consumption
of electricity. In 2018, in light of the significant increase in production (+11.70% total metres
of fabric produced), the increase recorded for methane gas was +9.28% while for electricity
it was +3.88%.
Relating consumption to metres of fabric produced therefore gives a reduction of 2.17% for gas consumption and 7.00% for electricity consumption.
The photovoltaic plant, installed at the Guanzate premises in 2012, facilitated the production in 2018 of around 832,536 kWh (2,997 GJ) of electricity from renewable sources, an increase of 6,613 kWh (24 GJ) compared with 2017.
CO2 emissions
For the Ratti Group, CO2 emissions are essentially due to energy consumption.
The energy efficiency actions implemented allowed the increase in CO2 emissions to be contained (+9.26%), despite the greater increase in production (+11.70%). In fact, if we relate total emissions to metres of fabric produced, a fall of emissions of 2.18% is recorded, compared with 2017.
Furthermore, in 2018 Ratti’s photovoltaic plant
at the Guanzate premises produced 832,536 kWh of electricity, of which 97% was consumed by
the company and 3% released to the grid, thereby avoiding total emissions of 300 tons of CO2.
Energy consumption of the Ratti Group for offices and factories
Units of measurement GJ
2018 SUSTAINABILITY REPORT | RATTI GROUP
Tab. 1 - Aggregated energy consumption for factories and offices in Italy, Tunisia and Romania1
2016
2017
2018
Variation
Methane gas* Electricity**
Total consumption
of which purchased
of which produced and self-consumed, from photovoltaic systems (Guanzate premises)
121,563
28,125
2,790
0.036
0.009
127,597
28,598
2,764
0.033
0.008
139,433
29,662
2,917
0.032
0.007
9.28%
3.72%
5.52%
-2.17%
-7.00%
Total consumption
30,915
31,362
32,579
3.88%
152,478
158,958
172,012
8.21%
2016
2017
2018
Variation
Total energy consumption
Energy consumption of the Ratti Group for offices and factories over metres of fabric produced
GJ/m
Consumption of methane gas over metres of fabric produced
Consumption of electricity over metres of fabric produced
1 The Creomoda plant in Tunisia does not consume methane gas
* The conversion into Gigajoules was performed using the PCI factor published in the ISPRA “Table of parameters for national standards” for the respective years.
** The percentage of electricity produced from renewable sources and consumed by the Group depends on individual national electricity mixes. In Italy there is also self-consumption of renewable energy produced from photovoltaic systems.
Tab. 2 - CO2 Emissions the Ratti Group*
u.m. tCO2
SCOPE 1 - Direct Emissions*
from the consumption of methane gas and refrigerant gas leaks
of the air-conditioning systems
SCOPE 2 - Indirect Energy Emissions**
Location-based from the purchase of electricity for offices and factories
SCOPE 2 - Indirect Energy Emissions - Market-based ***
from electricity bought for offices and factories
Total SCOPE 1 and SCOPE 2 location-based emissions
Total SCOPE 1 and SCOPE 2 location-based emissions over metres of fabric produced (u.m. tCO2 /m)
6,752
2,935
3,402
9,687
0.0028
7,133
2,983
3,683
10,116
0.0026
8,087
2,966
3,917
11,054
0.0025
13.38%
-0.56%
6.34%
9.26%
-2.18%
2016
2017
2018
Variation
* For the consumption of methane gas, the data is calculated on the basis of emission factors published in the “Table of parameters for national standards” published by the Ministry of the Environment and for the Protection of Land and Sea, for the respective years. The source of the GWP (Global Warming Potential) values used to calculate the emissions from refrigerant gas leaks is the IPCC 4th Assessment Report, 2007
** Data calculated on the basis of emissions factors published by Terna SpA’s “International comparisons” 2017. *** Data calculated on the basis of emissions factors published by the Association of Issuing Bodies (AIB) “European Residual Mixes” 2016 for the year 2016 and “European Residual Mixes” 2017 for the years 2017 and 2018.
55
