
Page 26 - Black Range Naturalist, Vol. 2, No. 1
P. 26
Seasonal Bird Species Distribution in
Hillsboro (January - June)
by Bob Barnes
Since 2007 we have kept a yard list of the bird species (and a few bird sub-species) which visit our yard in Hillsboro, New Mexico. The lot is 80’ x 200’; there are structures in the adjacent lots to the east and west and roads to the north and south. Hillsboro is a small community at 5,250’ on the east slope of the Black Range of southwestern New Mexico. The community is a few blocks long, and at the point where we reside there are two unpaved streets to the south with a row of houses between them. Past the most southerly road a desert landscape covers a slope which rises to a mesa. To the north there is a paved street, a row of homes, and then a stream/ wash (Percha Creek). These boundaries are mentioned here because they appear to be quite influential in determining the absence or presence of bird species. There are several species which enter town from the south, for instance, but generally make it no farther than the first row of lots. Gambel’s Quail and Greater Roadrunner are within this category.
Although we are fairly studious when we are present, we are not always present so our records do not represent a comprehensive listing of possible sightings. The information we have gathered is presented in two formats here. The first is a summary of activity which is color coded (see next paragraph) but lacks specific detail. The second set of charts has greater granularity. In these charts I have indicated the number of years for which we have records, for the week, in the top row. (Because of the number of records, we have “lumped” data into weeks.) For instance, January 1- 7 is the first data column. Red-winged Blackbird is the first species listed. During the eight years for which we have records for this first week, we have seen the Red-winged Blackbird in only one year, 2013. Entries are made for all years in which we have seen a species, during a particular week.
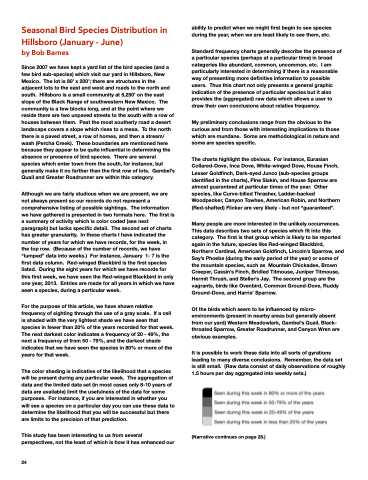
For the purpose of this article, we have shown relative frequency of sighting through the use of a gray scale. If a cell is shaded with the very lightest shade we have seen that species in fewer than 20% of the years recorded for that week. The next darkest color indicates a frequency of 20 - 49%, the next a frequency of from 50 - 79%, and the darkest shade indicates that we have seen the species in 80% or more of the years for that week.
The color shading is indicative of the likelihood that a species will be present during any particular week. The aggregation of data and the limited data set (in most cases only 8-10 years of data are available) limit the usefulness of the data for some purposes. For instance, if you are interested in whether you will see a species on a particular day you can use these data to determine the likelihood that you will be successful but there are limits to the precision of that prediction.
This study has been interesting to us from several perspectives, not the least of which is how it has enhanced our
ability to predict when we might first begin to see species during the year, when we are least likely to see them, etc.
Standard frequency charts generally describe the presence of a particular species (perhaps at a particular time) in broad categories like abundant, common, uncommon, etc. I am particularly interested in determining if there is a reasonable way of presenting more definitive information to possible users. Thus this chart not only presents a general graphic indication of the presence of particular species but it also provides the (aggregated) raw data which allows a user to draw their own conclusions about relative frequency.
My preliminary conclusions range from the obvious to the curious and from those with interesting implications to those which are mundane. Some are methodological in nature and some are species specific.
The charts highlight the obvious. For instance, Eurasian Collared-Dove, Inca Dove, White-winged Dove, House Finch, Lesser Goldfinch, Dark-eyed Junco (sub-species groups identified in the charts), Pine Siskin, and House Sparrow are almost guaranteed at particular times of the year. Other species, like Curve-billed Thrasher, Ladder-backed Woodpecker, Canyon Towhee, American Robin, and Northern (Red-shafted) Flicker are very likely - but not “guaranteed”.
Many people are more interested in the unlikely occurrences. This data describes two sets of species which fit into this category. The first is that group which is likely to be reported again in the future, species like Red-winged Blackbird, Northern Cardinal, American Goldfinch, Lincoln’s Sparrow, and Say’s Phoebe (during the early period of the year) or some of the mountain species, such as Mountain Chickadee, Brown Creeper, Cassin’s Finch, Bridled Titmouse, Juniper Titmouse, Hermit Thrush, and Steller’s Jay. The second group are the vagrants, birds like Ovenbird, Common Ground-Dove, Ruddy Ground-Dove, and Harris’ Sparrow.
Of the birds which seem to be influenced by micro- environments (present in nearby areas but generally absent from our yard) Western Meadowlark, Gambel’s Quail, Black- throated Sparrow, Greater Roadrunner, and Canyon Wren are obvious examples.
It is possible to work these data into all sorts of gyrations leading to many diverse conclusions. Remember, the data set is still small. (Raw data consist of daily observations of roughly 1.5 hours per day aggregated into weekly sets.)
(Narrative continues on page 28.)
24
