
Page 80 - Geologic Investigations in the Lake Valley Area, Sierra County, New Mexico
P. 80
even small leachable fractions can still result in the release of significant quantities of an element when many tons of material at the dump surface are exposed to and leached by natural waters, especially if these waters are acidified by oxidation of sulfide minerals.
Finally, we consider something not otherwise considered in this study—the Cu to Mo ratio. Generally, the ratio in for- age plants must exceed 1, or there is risk of molybdenosis (Erd man, 1990). Initially it would seem as if this is not an issue, for the bulk concentrations of Cu always well exceed those of Mo in the bulk concentrations of the dump samples. However, Mo has much greater solubility and, hence, mobility into the environment at these circum-neutral to slightly alkaline pH val ues of the leachates (fig. 2B). Although the data here are sim ply the solubility concentrations and not those of plants, we should note that the leachate Cu:Mo ratio is always < 1 and tends to get lower with additional leaching—for dump sample
3, the ratio is 0.81 in 24 hours and 0.45 in 48 hours. If local forage plant species do not discriminate in their uptake of these two elements from their dissolved ratio, they could acquire problematic concentrations of Mo that could become geoenvironmentally detrimental.
Summary and Conclusions
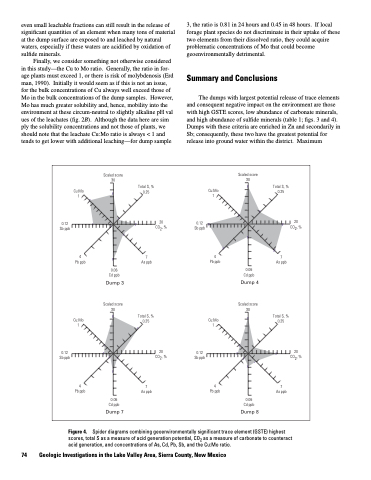
The dumps with largest potential release of trace elements and consequent negative impact on the environment are those with high GSTE scores, low abundance of carbonate minerals, and high abundance of sulfide minerals (table 1; figs. 3 and 4). Dumps with these criteria are enriched in Zn and secondarily in Sb; consequently, these two have the greatest potential for release into ground water within the district. Maximum
Scaled score 30
Scaled score 30
F
F
F
Total S, %
0.25 11
Total S, % 0.25
F
Cu:Mo F F
Cu:Mo
F
0.12 F
Sb ppb F
F
F
F 20 CO2, %
0.12 F Sb ppb
20 CO2, %
F
4 F 7 4 7
F
Pb ppb
As ppb
Pb ppb
As ppb
0.06 Cd ppb
Dump 3
Scaled score 30
0.06 Cd ppb
Dump 4
Scaled score 30
Total S, %
0.25 11
F
F
0.12 F F 20 0.12 F F 20
F
Total S, % F 0.25
Cu:Mo
Cu:Mo
Sb ppb F
F CO2, % Sb ppb F
CO2, %
F
4747
Pb ppb
As ppb
Pb ppb
As ppb
0.06 Cd ppb
Dump 7
0.06 Cd ppb
Dump 8
F
F F
Figure 4. Spider diagrams combining geoenvironmentally significant trace element (GSTE) highest scores, total S as a measure of acid generation potential, CO2 as a measure of carbonate to counteract acid generation, and concentrations of As, Cd, Pb, Sb, and the Cu:Mo ratio.
74 Geologic Investigations in the Lake Valley Area, Sierra County, New Mexico
