
Page 18 - UKRRptOct19
P. 18
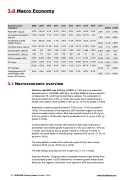
3.0 Macro Economy
Business cycle indicators
2008
2009
2010
2011
2012
2013
2014
2015
2016
2017
2018E
2019E
Real GDP, chg yoy
2.3%
-14.8%
4.1%
5.2%
0.2%
0.0%
-6.6%
-9.8%
2.3%
2.5%
3.3%
2.70%
Household consumption, chg yoy
11.8%
-14.9%
7.1%
15.7%
8.4%
6.9%
-8.3%
-20.7%
1.8%
7.8%
8.9%
4.90%
Investments in fixed capital, chg yoy
1.6%
-50.5%
3.9%
7.1%
5.0%
-6.7%
-24.0%
-9.2%
20.1%
18.2%
14.3%
7.00%
Industrial output, chg yoy
-5.2%
-21.9%
11.2%
8.0%
-0.7%
-4.3%
-10.1%
-13.0%
2.8%
0.4%
1.1%
2.50%
Nominal GDP, UAH bln
948
913
1,079
1,300
1,405
1,465
1,587
1,989
2,383
2,983
3,559
4,021
Nominal GDP, USD bln
180
117
136
163
176
183
134
91
93
112
131
146
GDP per capita, USD
3,891
2,550
2,972
3,580
3,865
4,030
3,117
2,134
2,193
2,638
3,077
3,336
CPI (eop)
22.3%
12.3%
9.1%
4.6%
-0.2%
0.5%
24.9%
43.3%
12.4%
13.7%
9.8%
7.10%
CPI average
25.2%
15.9%
9.4%
8.0%
0.6%
-0.3%
12.1%
48.7%
13.9%
14.4%
10.90 %
8.20%
Unemployment (ILO methodology, avg)
6.9%
9.6%
8.9%
8.7%
8.2%
7.8%
9.7%
9.5%
9.7%
9.9%
9.1%
8.00%
Source: SP Advisors
3.1 Macroeconomic overview
Ukraine’s real GDP rose 4.6% y/y in 2Q19, or 1.6% qoq on a seasonally adjusted basis, to UAH928bn ($34.9bn), the State Statistics Service reported on September 18, confirming its preliminary estimate. The acceleration in economic growth (from 2.5% y/y 1Q19) was mostly due to advancement in private consumption, which swelled 11.8% y/y (vs. 10.7% y/y growth in 1Q19).
Meanwhile, investment growth slowed to 7.9% y/y (vs. 17.4% y/y growth in 1Q19). The contribution of net exports to GDP remained negative as import volume exceeded export volume. Real export growth slowed to 4.4% y/y (vs. 6.8% y/y growth in 1Q19) while imports accelerated to 9.1% y/y (vs. 6.5% y/y growth in 1Q19).
On the production side, stronger GDP growth in 2Q19 was mostly due to accelerated value-added growth in agriculture (7.3% y/y in 2Q19 vs. 3.4% y/y in 1Q19), and mining (3.5% y/y growth in 2Q19 vs. 0.4% y/y in 1Q19). In addition, the value added in manufacturing increased 0.8% y/y (vs. a 1.3% y/y decline in 1Q19).
The value added in construction continued to grow at high rates, though cooling to 20.5% y/y (vs. 26.5% y/y in 1Q19).
The GDP deflator amounted to 9.4% in 2Q19 (vs. 11.7% in 1Q19).
Evgeniya Akhtyrko: “Surging private consumption was the major driving force of accelerated growth in 2Q19. Meanwhile, investment growth slowed down. Moreover, the negative contribution of net exports to GDP was reinforced by
18 UKRAINE Country Report October 2019 www.intellinews.com
