
Page 27 - TURKRptSept19
P. 27
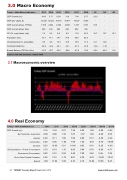
3.0 Macro Economy
Turkey - Main Macro Indicators
2013 2014
2015
6.09 10,915 2,339 859 8.8 78.7 10.3 -32.1 -23.5
2016
3.18 10,817 2,609 863 8.5 79.8 10.9 -33.1 -29.9
2017
7.44 10,537 3,107 852 11.9 80.8 10.9 -47.3 -47.8
2018
2.57 9,346 3,701 766 20.3 82.0 11.0 -27.8 -72.6
Q1
-2.62 - 915 - 19.7 - 14.1 -1.94 -36.2
Q2
-
-
-
- 15.7 - 12.8 -1.32 -42.4
Q3
-
-
-
- 16.7 -
-
- 9.9
GDP Growth (y/y)
GDP (per capita, $)
GDP (current prices, TRYbn)
GDP (current prices, $bn)
CPI (%, eop) (latest: July)
Population (mn)
Unemployment (%, eop) (May)
CA Deficit (USD bn)
Budget Balance (TRYbn) (July)
source: imf, tuik, treasury, central bank
3.1 Macroeconomic overview
4.0 Real Economy Turkey - GDP breakdown (%)
2018
Q1/18
Q2/18
Q3/18
Q4/18
Q1/19
GDP Growth (y/y)
By Production -Agriculture
Industry Construction Services By Expenditure - Private Consumption Government Consumption Gross Fixed Capital Formation Exports
10.90 5.61 10.48 6.10 1.15 8.95 5.01 3.59 3.49 7.81 -1.73 8.81
11.94 7.49 0.74
1.50
8.92
5.84
7.80
4.78 -4.75 4.15 13.64
-2.98 -0.46 -6.36 -8.70 -0.26 -8.90
-2.62 2.53 -4.34 -10.89 -4.00 -4.71
27 TURKEY Country Report September 2019
www.intellinews.com
8.49 5.17 12,395 12,022 1,810 2,044 950 934 7.4 8.2 76.7 77.7 9.0 9.9 -63.6 -43.6 -18.5 -22.7
2016
3.18 -2.58 4.20 5.40 0.20 3.70 9.50 2.20 -1.90
2017
7.44
4.88
9.11
9.00 -1.92 7.99
2.57
1.32
1.06 7.90
7.36 5.35 7.27 -1.07 4.00
1.84
1.84
0.13
-5.57
4.81
0.79
3.42 0.46 7.22
-12.90 -13.01 10.56 9.47
