
Page 48 - RusRPTFeb21
P. 48
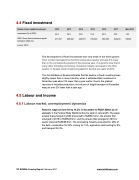
4.4 Fixed investment
Russia -Fixed capital investment 2012 2013 2014 2015 2016 2017 Mar-2018
Investment (% of GDP)
24.3 22.9 22.0 21.4 22.5 23.5 15.3
GDP: Gross fixed investment capital formation (USD mn)
471,337 496,982 428,573 276,240 280,350 342,294 58,303
source: CEIC
The development of fixed investment was very weak in the third quarter.
Their number decreased for the third consecutive quarter and was 6% lower than in the corresponding period of the previous year. It is good to note that in many other emerging economies, investment clearly recovered in the third quarter. In Russia, fixed investment peaked in the first ten years of 2013.
The Central Bank of Russia estimates that the decline in fixed investment was slightly slower than in recent months, when it estimated that investment in November was about 3% lower than a year earlier. Due to the gradual recovery of industrial production, the volume of freight transport in November was just over 2% lower than a year ago.
4.5 Labour and income
4.5.1 Labour market, unemployment dynamics
Russia’s wage arrears fell by 14.2% in December to RUB1.628bn as of January 1, the Federal State Statistics Service said on January25. The wage arrears that emerged in 2020 amounted to RUB681.2mn, the arrears that emerged in 2019 to RUB348.5mn, and the arrears that emerged in 2018 or earlier stood at RUB598.6mn. The processing industry accounted for 40% of the debt, construction for 23%, mining for 15%, agriculture and hunting for 8%, and transport for 5%.
48 RUSSIA Country Report February 2021 www.intellinews.com
