
Page 31 - TURKRptJul19
P. 31
18 months from 12 months for some purchases on credit, including for white goods and furniture. Data from TURKBESD also showed that white goods exports increased by 3% y/y to 1.74mn units while the increase in shipments to foreign markets remained flat at 7.44mn units in January-May. White goods production was up 6% to 2.4mn units. In the first five months of the year, production was almost unchanged at 10.2mn units.
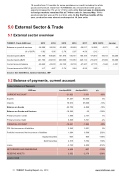
5.0 External Sector & Trade 5.1 External sector overview
TURKEY -Trade (USD mn)
2013
2014
2015
2016
2017
2018
Q1/19
Jan-Apr
Balance on goods & services
-56,299
-36,918
-23,900
-25,629
-39,017
-16,260
-3,071
-32
(% of GDP)
-5.92
-3.95
-2.78
-2.97
-4.58
-2.12
-
-
Goods exports (BoP)
161,789
168,926
151,970
150,161
166,159
174,610
44,813
60,200
Goods imports (BoP)
241,706
232,519
200,098
191,053
225,114
216,479
47,884
65,099
Current account balance
-63,642
-43,610
-32,145
-33,139
-47,347
-27,115
-1,944
-3,331
Current account to GDP (%)
-6.7
-4.67
-3.74
-3.84
-5.56
-3.63
-
-
Source: bne IntelliNews, national statistics, IMF
5.2 Balance of payments, current account
Turkey's Balance of Payments
USD mn
CURRENT ACCOUNT
Exports
Imports
Balance on Goods
Balance on Goods and Services Primary Income: Credit
Primary Income: Debit FINANCIAL ACCOUNT
FDI: Net incurrence of liabilities
Portfolio Invesment: Net incurrence of liabilities
Jan-Apr/2018
-21,822 57,207 79,916
-22,709 -18,266 1,998 5,838 -19,421 3,245 1,684 -834 2,518 -3,745
4,428 2,052
Jan-Apr/2019
y/y
-3,331
-85%
60,200
5%
65,099
-19%
-4,899
-78%
-32
-100%
2,147
7%
5,701
-2%
-1,993
-90%
3,251
0%
6,598
292%
804
-196%
5,794
130%
4,202
-212%
-857
-119%
-2,170
-206%
Equity Securities Debt Securities
Loans
NET ERRORS AND OMISSSIONS RESERVE ASSETS
source: tcmb
31 TURKEY Country Report July 2019
www.intellinews.com
