
Page 43 - RusRPTSept20
P. 43
export of goods 32.5 33.4 33.8 35.0 36.1 35.4 34.9 29.5 28.1 29.6 23.5 20.9 24.2
import of goods
good trade balance
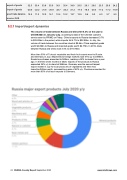
source: GKS
-20.0 -22.2 -21.8 -20.9 -23.7 -23.2 -21.2 -17.0 -18.5 -20.3 -17.2 -17.2 -18.9
12.5 11.2 12.0 14.1 12.4 12.2 13.7 12.5 9.6 9.3 6.3 3.7 5.3
5.2.1 Import/export dynamics
The volume of trade between Russia and China fell 4.3% on the year to US $58.82bn in January–July, according to data of the Chinese customs service seen by PRIME on Friday. China’s exports to Russia decreased 3.7% to $25.82bn in the period, while imports fell 4.7% to $32.99bn. In July, the volume of trade between the countries stood at $9.6bn. China supplied goods worth $4.89bn to Russia and imported goods worth $4.77bn. In 2019, trade between Russia and China rose 3.4% to $110.75bn.
More than 50% of Turkey’s vegetable and fresh fruit exports went to Russia and Germany in July. Shipments to foreign markets rose 41% y/y to $186mn. Russia’s purchases amounted to $45mn, marking a 52% increase from a year ago. In the first seven months of 2020, exports of the products to Russia expanded 34% y/y to stand at $464mn. Germany was the second largest export market in July for local producers of vegetables and fresh fruit, importing $45mn worth, representing a gain of 42% y/y. Cherries accounted for more than 65% of all such exports to Germany.
43 RUSSIA Country Report September 2020 www.intellinews.com
