
Page 6 - BELRptJuly18
P. 6
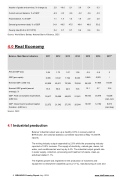
Imports of goods and services, % change y/y 2.0 -10.6 -2.1 3.9 5.4 6.3
Current account balance, % of GDP -6.9 -3.3 -3.6 -3.2 -3.6 -3.5
Fiscal balance, % of GDP 1.1 1.4 1.5 1.9 2.0 2.0
General government debt, % of GDP 34.1 48.5 47.5 49.4 49.8 50.2
Poverty rate ($5.5 in 2011 PPP) 0.4 0.7 0.7 0.6 0.6 0.6
Source: World Bank, Belstat, National Bank of Belarus, CEIC
4.0  Real Economy
Belarus - Main Macro Indicators 2011 2012 2013 2014 2015 2016 2017*
Annual GDP (y/y)
5.54 1.73 1.07 1.59 -3.9 -2.8 2
GDP (per capita) 6,306 6,722 7,722 8,040 5,949 5,023 /
Nominal GDP, (USD mn) 62,929 65,611 75,389 78,594 56,503 47,836 54,381
Nominal GDP growth (annual 76.5 88.6 22.9 15.8 12.1 5.7 10.6 average), %
GDP: Final consumption expenditure, 39,417 39,698 48,603 51,961 (USD mn)
40,003
35,479
18,208 (Jan-Jun)
GDP: Gross fixed investment capital 22,372 21,342 27,376 26,004 formation, (USD mn)
16,091
12,192
8,873 (Jan-Sep)
Source: CEIC
4.1  Industrial production
Belarus' industrial output was up a healthy 8.8% in January-April at BYR35.2bn, the national statistics committee reported on May 16, BelTA reports.
The mining industry output expanded by 2.8% while the processing industry reported a 10.2% increase. The supply of electricity, natural gas, steam, hot water, and conditioned air went up by 4.4%. The industrial output growth rate in water supply, collection, processing and treatment of waste, clean-up activities totalled 1.1%.
The highest growth was registered in the production of machines and equipment not elsewhere classified (up by 21.1%), manufacturing of coke and
6  BELARUS Country Report  July 2018    www.intellinews.com
