
Page 14 - bne_Magazine_July_2017
P. 14
14 I Companies & Markets bne July 2017
FDI also edged upward in Ukraine, although wiiw pointed out that, “The elevated investment risk is reflected in the low FDI inflow compared with the size of the country.”
Going forward, the picture for the wider CESEE region is also a positive one, with FDI set to exceed the heights reached in 2016. “The trend in CESEE is expected to continue due to robust economic growth in the region and a somewhat lower but still stable growth in the major investing countries,” the report said.
“Economic growth in most of CESEE is bound to be more robust than in the previous year. Both consumption and investments recover and attract foreign companies in the EU-CEE and the Western Balkans,” it said. “These regions have maintained cost competitiveness, despite surg-
ing wages and occasional labour shortages, by benefit- ing from considerable productivity improvements.”
Despite uncertainties in the international economic environment, these forecasts have been borne out by first- quarter developments in several key economies, in particular by the greenfield FDI projects announced in Hungary, Poland, Romania and Serbia.
“The trend in CESEE is expected
to continue due to robust economic growth in the region”
However, it wasn’t all good news. Rising FDI in CESEE took place against the backdrop of falling global FDI, mainly attributed to lower foreign investment in China. And while Central Europe and the CIS-4 plus Ukraine regions powered ahead, Turkey reported a 30% decline in FDI, while a more modest 7% tailing off was seen in the Western Balkans. Notably, this was a reversal of the situation the previous year, when Turkey and the Western Balkans outperformed their peers to the north and east.
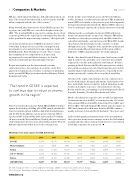
FDI inflows in the main regions of CESEE, EUR million
Yet the decline wasn’t uniform across the Western Balkans. Serbia, its largest economy and top recipient of FDI, maintained inward FDI levels similar to the previous year, driven upwards by major inward investments like the Chinese HBIS’s takeover of its second largest exporter, the Zelezara Smederevo steel mill.
Albania was the second ranked recipient of FDI, with invest- ments concentrated in the energy sector. Albania’s FDI inflows actually rose above the pre-crisis period, and Macedonia also – somewhat surprisingly – saw an increase in FDI in 2016, despite the political crisis that weighed on the country’s economy throughout the year. “Suppliers of the automotive industry and electronics make [Macedonia] unique in the region, with its high share of FDI in manufacturing,” the study explained.
On the other hand, Bosnia & Herzegovina “was less successful than in earlier years, probably on account of its increasingly segmented economic and regulatory environment”. Bosnia’s growing political divisions and the rifts among its two entities and central government are deterring foreign investors; in Feb- ruary German retailer Lidl was the latest to reportedly decide against entering the country due to its political instability.
In terms of the origin of investments, the top country sources are the Netherlands, Germany and Austria. Austrian investors have particularly targeted countries in their immediate neigh- bourhood, being the top source of investment for Slovenia, Bosnia and Croatia, and ranking second in Bulgaria, the Czech Republic, Romania, Slovakia, Macedonia and Serbia.
On the other hand, the region became notably less important for Austrian investors in 2016, accounting for only 31% of Aus- trian outward FDI stock in 2016, down from 36% in 2015 and 46% in 2012. “Overall Austrian FDI outflow turned negative in 2016 and continued its shift away from the CESEE countries, mainly in favour of Asia and the Netherlands,” the report said.
Aside from Germany and Austria, much of the investment in the region was from low-tax countries such as the Netherlands and Luxembourg, where many investments were concentrated in holding companies for tax reasons.
Bank
2010
2011
2012
2013
2014
2015
2016
EU-CEE 23,278 25,174 30,018 13,271 27,061 23,645 29,020
WesternBalkans 3,473 5,675 2,806 3,568 3,503 4,406 4,098
Turkey
CIS-3 + Ukraine
Russia
CEESEE TOTAL
6,864 11,625 10,607
14,790 18,208 18,174
23,875 26,476 23,483
72,279 87,159 85,089
9,710 9,656 15,818
13,031 8,206 7,974
40,196 22,037 10,664
79,777 70,464 62,507
11,115
12,318
34,012
90,564
EU-CEE: European Union – Central and Eastern Europe.CESEE: Central, East and Southeast Europe.
CIS-3: Belarus, Kazakhstan, Moldova. Data exclude Special Purpose Entities (SPEs).Source: wiiw FDI Database.
www.bne.eu
