
Page 20 - TURKRptOct21
P. 20
move up 2% y/y to 2.17mn tonnes. It also assessed that chicken meat output would grow 3% in 2022 to reach 2.23mn tonnes.
Chicken meat consumption in the country of 84mn, the FAS forecast, would in 2022 reach 1.69mn tonnes on increased exports, high market prices and insufficient production volumes.
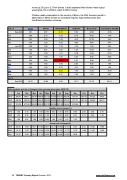
m/m, %
ENAG
Official
ENAG/Official
USD/TRY
Brent oil ($)
Commodities (BCOM)
Sep-2020
3.61
0.97
3.72
5.02
-9.56
-3.36
Oct
2.56
2.13
1.20
8.15
-8.52
1.40
Nov
3.43
2.30
1.49
-6.19
27.04
3.50
Dec
4.08
1.25
3.26
-4.97
8.85
4.97
Jan-2021
2.99
1.68
1.78
-1.74
7.88
2.62
Feb
1.84
0.91
2.02
1.54
18.34
6.47
Mar
3.36
1.08
3.11
11.06
-3.92
-2.15
April
2.62
1.68
1.56
0.36
5.84
8.29
May
3.94
0.89
4.43
2.51
3.08
2.73
Jun
3.28
1.94
1.69
2.63
8.38
1.85
Jul
4.89
1.80
2.72
-3.11
1.60
1.83
Aug
4.06
1.12
3.63
-1.53
-4.38
-0.30
Sep
2.89
1.25
2.31
7.00
7.58
4.97
y/y, %
Sep-2021
44.70
19.58
2.28
15.17
91.75
42.21
Index numbers and rate of changes in the consumer price index, 2005=100
Jan
Feb
Mar
Apr
May
Jun
Jul
Aug
Sep
Oct
Nov
Dec
2019
398.07
398.71
402.81
409.63
413.52
413.63
419.24
422.84
427.04
435.59
437.25
440.5
2020
446.45
448.02
450.58
454.43
460.62
465.84
468.56
472.61
477.21
487.38
498.58
504.81
2021
513.30
517.96
523.53
532.32
537.05
547.48
557.36
563.6
570.66
Monthly rate of change (%)
2019
1.06
0.16
1.03
1.69
0.95
0.03
1.36
0.86
0.99
2.00
0.38
0.74
2020
1.35
0.35
0.57
0.85
1.36
1.13
0.58
0.86
0.97
2.13
2.30
1.25
2021
1.68
0.91
1.08
1.68
0.89
1.94
1.80
1.12
1.25
Annual rate of change (%)
2019
20.35
19.67
19.71
19.50
18.71
15.72
16.65
15.01
9.26
8.55
10.56
11.84
2020
12.15
12.37
11.86
10.94
11.39
12.62
11.76
11.77
11.75
11.89
14.03
14.60
2021
14.97
15.61
16.19
17.14
16.59
17.53
18.95
19.25
19.58
20 TURKEY Country Report October 2021 www.intellinews.com
